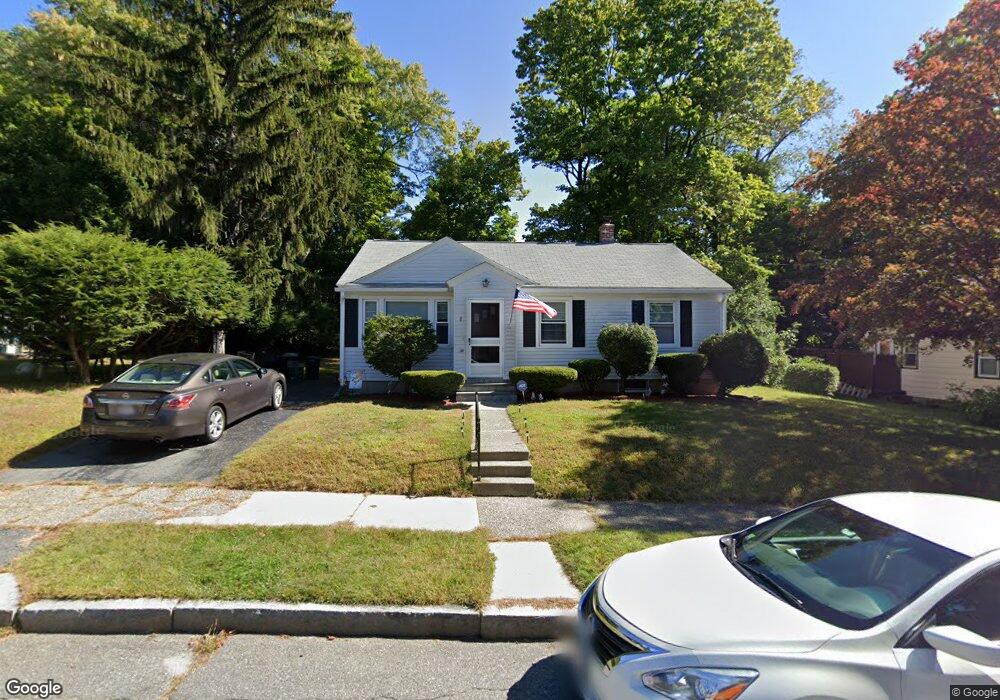
8 Pomona Rd Worcester, MA 01602
West Tatnuck NeighborhoodEstimated Value: $378,762 - $413,000
3
Beds
1
Bath
960
Sq Ft
$413/Sq Ft
Est. Value
About This Home
This home is located at 8 Pomona Rd, Worcester, MA 01602 and is currently estimated at $396,191, approximately $412 per square foot. 8 Pomona Rd is a home located in Worcester County with nearby schools including Tatnuck Magnet School, Chandler Magnet, and Jacob Hiatt Magnet School.
Ownership History
Date
Name
Owned For
Owner Type
Purchase Details
Closed on
Aug 1, 2003
Sold by
Wolfe Anita A and Wolfe Eva R
Bought by
Bombard Carolann and Bombard Dennis J
Current Estimated Value
Home Financials for this Owner
Home Financials are based on the most recent Mortgage that was taken out on this home.
Original Mortgage
$176,700
Outstanding Balance
$75,882
Interest Rate
5.28%
Mortgage Type
Purchase Money Mortgage
Estimated Equity
$320,309
Create a Home Valuation Report for This Property
The Home Valuation Report is an in-depth analysis detailing your home's value as well as a comparison with similar homes in the area
Home Values in the Area
Average Home Value in this Area
Purchase History
| Date | Buyer | Sale Price | Title Company |
|---|---|---|---|
| Bombard Carolann | $186,000 | -- |
Source: Public Records
Mortgage History
| Date | Status | Borrower | Loan Amount |
|---|---|---|---|
| Open | Bombard Carolann | $176,700 |
Source: Public Records
Tax History
| Year | Tax Paid | Tax Assessment Tax Assessment Total Assessment is a certain percentage of the fair market value that is determined by local assessors to be the total taxable value of land and additions on the property. | Land | Improvement |
|---|---|---|---|---|
| 2025 | $4,184 | $317,200 | $110,300 | $206,900 |
| 2024 | $4,104 | $298,500 | $110,300 | $188,200 |
| 2023 | $3,956 | $275,900 | $95,900 | $180,000 |
| 2022 | $3,495 | $229,800 | $76,700 | $153,100 |
| 2021 | $3,329 | $204,500 | $61,300 | $143,200 |
| 2020 | $3,267 | $192,200 | $61,400 | $130,800 |
| 2019 | $3,069 | $170,500 | $55,200 | $115,300 |
| 2018 | $2,978 | $157,500 | $55,200 | $102,300 |
| 2017 | $2,981 | $155,100 | $55,200 | $99,900 |
| 2016 | $2,900 | $140,700 | $41,400 | $99,300 |
| 2015 | $2,824 | $140,700 | $41,400 | $99,300 |
| 2014 | $2,749 | $140,700 | $41,400 | $99,300 |
Source: Public Records
Map
Nearby Homes
- 23 Tiverton Pkwy
- 12 Cardinal Rd
- 122 Copperfield Rd
- 8 Modred Ct
- 118 Beaconsfield Rd
- 18 Merlin Ct Unit 18
- 9 Newburn Rd
- 47R Yarnie Unit 3A
- 47R Yarnie Unit 1B
- 47R Yarnie Unit 2B
- 47R Yarnie Unit 4B
- 47R Yarnie Unit 8B
- 47R Yarnie Unit 5A
- 47R Yarnie Unit 6B
- 47R Yarnie Unit 4A
- 47R Yarnie Unit 1A
- 47R Yarnie Unit 9
- 47R Yarnie Unit 8A
- 47R Yarnie Unit 6A
- 47R Yarnie Unit 7A
Your Personal Tour Guide
Ask me questions while you tour the home.