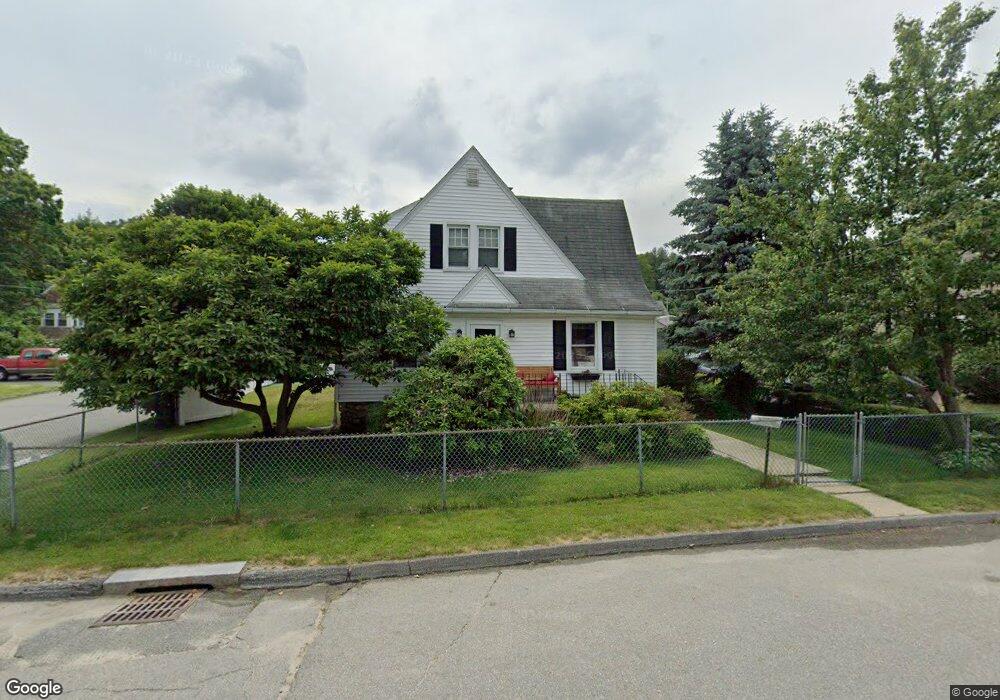
8 Quaboag St Worcester, MA 01602
Webster Square NeighborhoodEstimated Value: $428,000 - $445,000
3
Beds
1
Bath
1,402
Sq Ft
$311/Sq Ft
Est. Value
About This Home
This home is located at 8 Quaboag St, Worcester, MA 01602 and is currently estimated at $436,387, approximately $311 per square foot. 8 Quaboag St is a home located in Worcester County with nearby schools including Chandler Magnet, Jacob Hiatt Magnet School, and May Street Elementary School.
Ownership History
Date
Name
Owned For
Owner Type
Purchase Details
Closed on
Oct 6, 2020
Sold by
Kazarian Nicole
Bought by
Kazarian Nicole and Kazarian Gerald S
Current Estimated Value
Home Financials for this Owner
Home Financials are based on the most recent Mortgage that was taken out on this home.
Original Mortgage
$130,000
Outstanding Balance
$113,550
Interest Rate
2.8%
Mortgage Type
New Conventional
Estimated Equity
$322,837
Purchase Details
Closed on
Aug 27, 2004
Sold by
Ricker Cathy and Ricker Guy M
Bought by
Kazarian Nicole
Home Financials for this Owner
Home Financials are based on the most recent Mortgage that was taken out on this home.
Original Mortgage
$180,000
Interest Rate
6.02%
Mortgage Type
Purchase Money Mortgage
Purchase Details
Closed on
Dec 20, 1994
Sold by
Johnson Eileen Est and Mikelonis
Bought by
Ricker Guy and Ricker Cathy
Create a Home Valuation Report for This Property
The Home Valuation Report is an in-depth analysis detailing your home's value as well as a comparison with similar homes in the area
Home Values in the Area
Average Home Value in this Area
Purchase History
We collect this data history from publicly available records. To have your information removed, we recommend requesting removal directly through your county’s website.
| Date | Buyer | Sale Price | Title Company |
|---|---|---|---|
| Kazarian Nicole | -- | None Available | |
| Kazarian Nicole | $225,000 | -- | |
| Kazarian Nicole C | $225,000 | -- | |
| Ricker Guy | $55,200 | -- |
Source: Public Records
Mortgage History
We collect this data history from publicly available records. To have your information removed, we recommend requesting removal directly through your county’s website.
| Date | Status | Borrower | Loan Amount |
|---|---|---|---|
| Open | Kazarian Nicole | $130,000 | |
| Previous Owner | Kazarian Nicole C | $180,000 | |
| Previous Owner | Ricker Guy | $41,000 | |
| Previous Owner | Ricker Guy | $27,000 |
Source: Public Records
Tax History
| Year | Tax Paid | Tax Assessment Tax Assessment Total Assessment is a certain percentage of the fair market value that is determined by local assessors to be the total taxable value of land and additions on the property. | Land | Improvement |
|---|---|---|---|---|
| 2025 | $4,835 | $366,600 | $89,600 | $277,000 |
| 2024 | $4,712 | $342,700 | $89,600 | $253,100 |
| 2023 | $4,546 | $317,000 | $77,900 | $239,100 |
| 2022 | $4,201 | $276,200 | $62,300 | $213,900 |
| 2021 | $4,106 | $252,200 | $49,900 | $202,300 |
| 2020 | $3,973 | $233,700 | $49,500 | $184,200 |
| 2019 | $3,758 | $208,800 | $43,200 | $165,600 |
| 2018 | $3,752 | $198,400 | $43,200 | $155,200 |
| 2017 | $3,571 | $185,800 | $43,200 | $142,600 |
| 2016 | $3,594 | $174,400 | $31,800 | $142,600 |
| 2015 | $3,500 | $174,400 | $31,800 | $142,600 |
| 2014 | $3,408 | $174,400 | $31,800 | $142,600 |
Source: Public Records
Map
Nearby Homes
- 386 June St
- 29 Outlook Dr
- 4 Hamill Rd
- 47R Yarnie Unit 4A
- 12 Sherwood Rd
- 15 Circuit Ave E
- 14 Circuit Ave E
- 10 Minthorne St
- 109 S Flagg St
- 14 Hadwen Rd
- 60 Circuit Ave S
- 18 Sherer Trail
- 47 Carlisle St
- 51 Brantwood Rd
- 114 Lovell St
- 71 Morningside Rd
- 30 Parsons Hill Dr
- 618 Mill St
- 35 Iowa St
- 1 Ashmore Rd
Your Personal Tour Guide
Ask me questions while you tour the home.