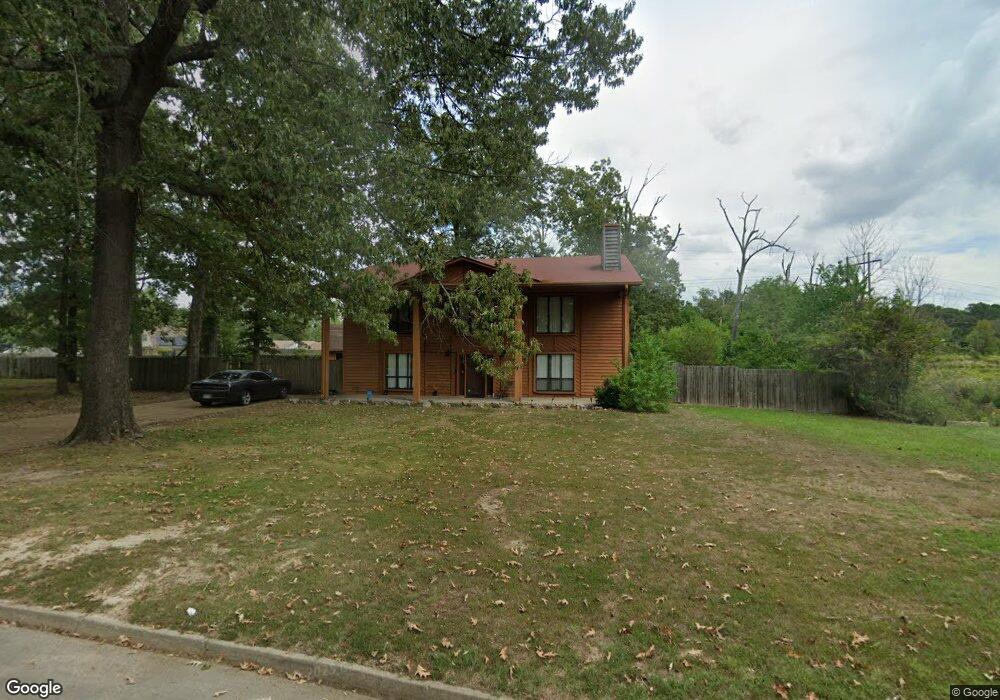
8 Regency Ln Pine Bluff, AR 71603
Estimated Value: $242,229 - $303,000
4
Beds
3
Baths
3,312
Sq Ft
$83/Sq Ft
Est. Value
About This Home
This home is located at 8 Regency Ln, Pine Bluff, AR 71603 and is currently estimated at $273,557, approximately $82 per square foot. 8 Regency Ln is a home located in Jefferson County with nearby schools including Matthews Elementary School, Dollarway High School, and Friendship Aspire Academy Pine Bluff.
Ownership History
Date
Name
Owned For
Owner Type
Purchase Details
Closed on
Jul 15, 2014
Sold by
Girdeep S Girdeep S and Khullar Neelam
Bought by
Battles Quentin D
Current Estimated Value
Home Financials for this Owner
Home Financials are based on the most recent Mortgage that was taken out on this home.
Original Mortgage
$156,289
Outstanding Balance
$118,877
Interest Rate
4.2%
Mortgage Type
New Conventional
Estimated Equity
$154,680
Purchase Details
Closed on
Dec 3, 2002
Bought by
Khullar Gurdeep S and Khullar Neelam
Purchase Details
Closed on
Dec 8, 1999
Bought by
Khullar Neelam Tangri Rev Tr
Purchase Details
Closed on
Jan 9, 1995
Bought by
Khullar Gurdeep S and Khullar Wf
Purchase Details
Closed on
Jul 18, 1988
Bought by
Dalrymple Stevan B and Dalrymple Wf
Purchase Details
Closed on
Oct 17, 1983
Bought by
Dalrymple John B and Dalrymple Wf
Create a Home Valuation Report for This Property
The Home Valuation Report is an in-depth analysis detailing your home's value as well as a comparison with similar homes in the area
Purchase History
| Date | Buyer | Sale Price | Title Company |
|---|---|---|---|
| Battles Quentin D | -- | -- | |
| Khullar Gurdeep S | -- | -- | |
| Khullar Neelam Tangri Rev Tr | -- | -- | |
| Khullar Gurdeep S | $134,000 | -- | |
| Dalrymple Stevan B | -- | -- | |
| Dalrymple John B | $15,000 | -- |
Source: Public Records
Mortgage History
| Date | Status | Borrower | Loan Amount |
|---|---|---|---|
| Open | Battles Quentin D | $156,289 |
Source: Public Records
Tax History
| Year | Tax Paid | Tax Assessment Tax Assessment Total Assessment is a certain percentage of the fair market value that is determined by local assessors to be the total taxable value of land and additions on the property. | Land | Improvement |
|---|---|---|---|---|
| 2025 | $3,246 | $49,480 | $2,040 | $47,440 |
| 2024 | $2,996 | $49,480 | $2,040 | $47,440 |
| 2023 | $2,747 | $49,480 | $2,040 | $47,440 |
| 2022 | $2,274 | $37,100 | $2,970 | $34,130 |
| 2021 | $2,274 | $37,100 | $2,970 | $34,130 |
| 2020 | $2,274 | $37,100 | $2,970 | $34,130 |
| 2019 | $2,274 | $37,100 | $2,970 | $34,130 |
| 2018 | $2,274 | $37,100 | $2,970 | $34,130 |
| 2017 | $2,221 | $36,230 | $2,970 | $33,260 |
| 2016 | $2,221 | $36,230 | $2,970 | $33,260 |
| 2015 | $2,112 | $36,230 | $2,970 | $33,260 |
| 2014 | -- | $36,230 | $2,970 | $33,260 |
Source: Public Records
Map
Nearby Homes
- 0000 Hampton Pkwy
- 6 Cromwell Cove
- 3 Hampton Place
- 5903 Hampton Pkwy
- 2203 Cherry Ridge Dr
- 2105 Monticello Ct
- 00 Ridgeway Rd
- Lot 48 U S 79
- 6009 S Cedar St
- 1503 Silver Fox Ln
- 1501 Blackhawk Ridge Ln
- 6 Summerset Place
- 10 Old Warren Rd
- 6600 S Mulberry St
- 4410 Town Country Ln
- 2403 Beau Monde St
- 10 Southern Pines Dr
- 4008 S Holly St
- 0 Shannon & Oakwood
- 1206 W 46th Ave
Your Personal Tour Guide
Ask me questions while you tour the home.