8 Rehobeth Rd Flanders, NJ 07836
Mount Olive AreaEstimated Value: $538,125 - $610,000
About This Home
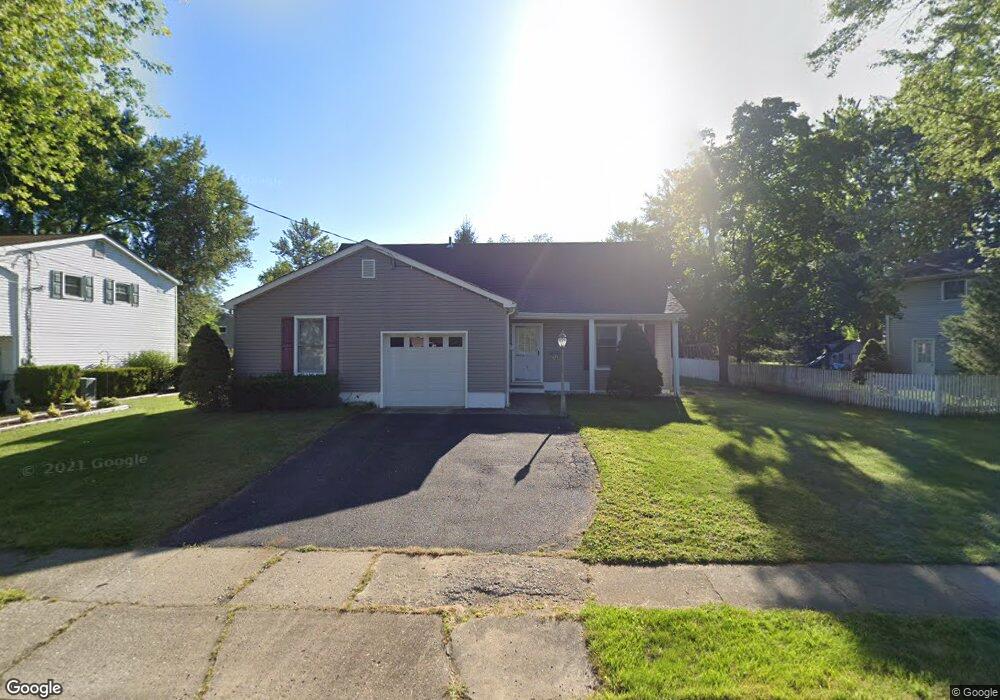
This home is located at 8 Rehobeth Rd, Flanders, NJ 07836 and is currently estimated at $579,031, approximately $347 per square foot. 8 Rehobeth Rd is a home located in Morris County with nearby schools including Mt Olive Middle School, Mount Olive High School, and American Christian School.
Ownership History
We collect this data history from publicly available records. To have your information removed, we recommend requesting removal directly through your county’s website.
Purchase Details
Home Values in the Area
Average Home Value in this Area
Purchase History
We collect this data history from publicly available records. To have your information removed, we recommend requesting removal directly through your county’s website.
| Date | Buyer | Sale Price | Title Company |
|---|---|---|---|
| $174,000 | -- |
Tax History
We collect this data history from publicly available records. To have your information removed, we recommend requesting removal directly through your county’s website.
| Year | Tax Paid | Tax Assessment Tax Assessment Total Assessment is a certain percentage of the fair market value that is determined by local assessors to be the total taxable value of land and additions on the property. | Land | Improvement |
|---|---|---|---|---|
| 2026 | $10,619 | $304,700 | $172,700 | $132,000 |
| 2025 | $10,619 | $304,700 | $172,700 | $132,000 |
| 2024 | $10,015 | $304,700 | $172,700 | $132,000 |
| 2023 | $10,015 | $304,700 | $172,700 | $132,000 |
| 2022 | $10,232 | $304,700 | $172,700 | $132,000 |
| 2021 | $10,232 | $304,700 | $172,700 | $132,000 |
| 2020 | $10,095 | $304,700 | $172,700 | $132,000 |
| 2019 | $10,061 | $304,700 | $172,700 | $132,000 |
| 2018 | $9,964 | $304,700 | $172,700 | $132,000 |
| 2017 | $9,790 | $304,700 | $172,700 | $132,000 |
| 2016 | $9,479 | $304,700 | $172,700 | $132,000 |
| 2015 | $9,702 | $304,700 | $172,700 | $132,000 |
| 2014 | $9,711 | $304,700 | $172,700 | $132,000 |
Map
- 21 Hillery Dr
- 7 Beekmeer Place
- 71 Clover Hill Dr
- 12 Brearly Crescent
- 177 Clover Hill Dr
- 9 Brearly Crescent
- 14 Allyson Rd
- 4 Virgil Ln
- 29 Downstream Dr
- 17 Cromwell Dr
- 30 Deer Path Dr
- 5 Downstream Dr
- 6 Snead Ct
- 689 Bartley Rd
- 4 Ashley Dr
- 64 Main St
- 2 Detoro Ct
- 36 Main St
- 16 Saint Andrews Ct
- 10 David Place
- 113 Clover Hill Dr
- 115 Clover Hill Dr
- 2 Rehobeth Rd
- 4 Rehobeth Rd
- 4 Rehoboth Rd
- 6 Rehobeth Rd
- 2 Rehoboth Rd
- 117 Clover Hill Dr
- 2 Renault Dr
- 10 Rehobeth Rd
- 10 Rehoboth Rd
- 119 Clover Hill Dr
- 3 Rehoboth Rd
- 112 Clover Hill Dr
- 12 Rehobeth Rd
- 7 Rehoboth Rd
- 7 Rehobeth Rd
- 1 Corvair Ct
- 4 Renault Dr
- 3 Rehobeth Rd
Ask me questions while you tour the home.