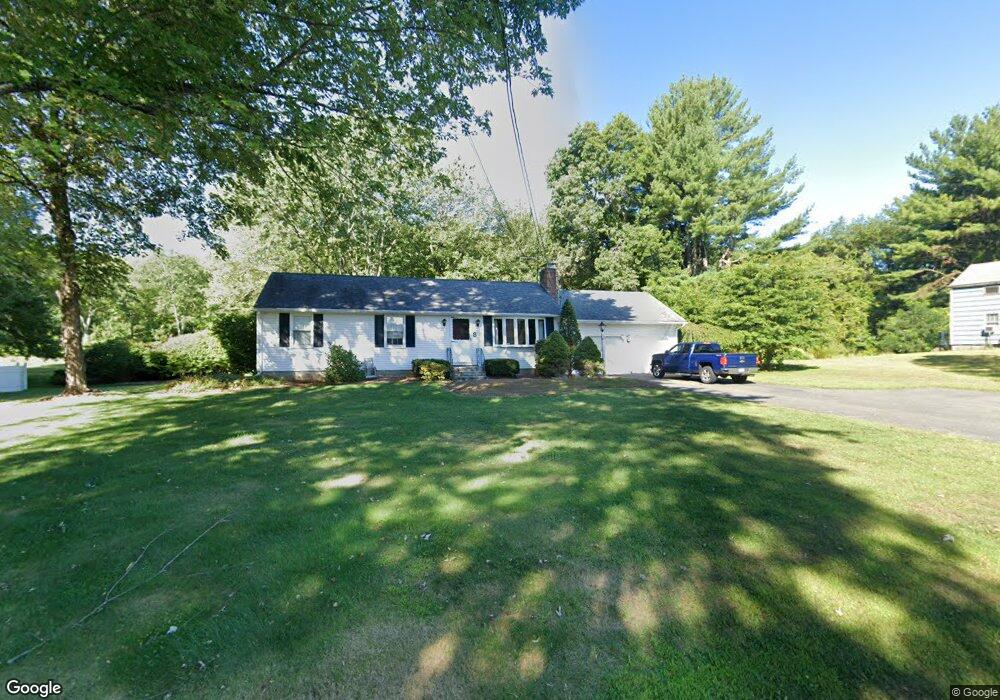
8 Rice Rd Broad Brook, CT 06016
Estimated Value: $277,000 - $325,899
3
Beds
1
Bath
1,188
Sq Ft
$258/Sq Ft
Est. Value
About This Home
This home is located at 8 Rice Rd, Broad Brook, CT 06016 and is currently estimated at $306,975, approximately $258 per square foot. 8 Rice Rd is a home located in Hartford County with nearby schools including Broad Brook Elementary School, East Windsor Middle School, and East Windsor High School.
Ownership History
Date
Name
Owned For
Owner Type
Purchase Details
Closed on
Jun 30, 2010
Sold by
Brouillard Diane
Bought by
Vandenburgh Richard
Current Estimated Value
Home Financials for this Owner
Home Financials are based on the most recent Mortgage that was taken out on this home.
Original Mortgage
$192,350
Outstanding Balance
$127,846
Interest Rate
4.88%
Estimated Equity
$179,129
Create a Home Valuation Report for This Property
The Home Valuation Report is an in-depth analysis detailing your home's value as well as a comparison with similar homes in the area
Home Values in the Area
Average Home Value in this Area
Purchase History
| Date | Buyer | Sale Price | Title Company |
|---|---|---|---|
| Vandenburgh Richard | -- | -- |
Source: Public Records
Mortgage History
| Date | Status | Borrower | Loan Amount |
|---|---|---|---|
| Open | Vandenburgh Richard | $192,350 | |
| Closed | Vandenburgh Richard | $192,350 | |
| Previous Owner | Vandenburgh Richard | $218,732 |
Source: Public Records
Tax History
| Year | Tax Paid | Tax Assessment Tax Assessment Total Assessment is a certain percentage of the fair market value that is determined by local assessors to be the total taxable value of land and additions on the property. | Land | Improvement |
|---|---|---|---|---|
| 2025 | $5,359 | $202,310 | $61,390 | $140,920 |
| 2024 | $4,969 | $202,310 | $61,390 | $140,920 |
| 2023 | $3,793 | $110,660 | $48,010 | $62,650 |
| 2022 | $4,114 | $110,660 | $48,010 | $62,650 |
| 2021 | $3,818 | $110,660 | $48,010 | $62,650 |
| 2020 | $3,842 | $110,660 | $48,010 | $62,650 |
| 2019 | $3,790 | $110,660 | $48,010 | $62,650 |
| 2018 | $3,751 | $110,660 | $48,010 | $62,650 |
| 2017 | $3,801 | $115,990 | $59,190 | $56,800 |
| 2016 | $3,588 | $115,990 | $59,190 | $56,800 |
| 2015 | $3,516 | $115,990 | $59,190 | $56,800 |
| 2014 | $3,454 | $115,990 | $59,190 | $56,800 |
Source: Public Records
Map
Nearby Homes
- 14 Bridle Path
- 33 Harrington Rd
- 62 Rice Rd
- 25 Bass Dr
- 24 Iroquois Rd
- 0 Wells Rd
- 29 Eastgate Ln
- 38 Eastgate Ln
- 57 Steele Rd
- 26 Julia Ct Unit 26
- 133 Weymouth Rd
- 18 Hudson St
- 233 Post Office Rd
- 86 Weymouth Rd
- 10 Thistle Way Unit D
- 4 Rye St
- 27 Folkstone Rd Unit C
- 29 Silver Ln
- 19 Copper Dr
- 111 Old Ellington Rd
Your Personal Tour Guide
Ask me questions while you tour the home.