8 Richardson Ct Methuen, MA 01844
Downtown Methuen NeighborhoodEstimated Value: $415,000 - $484,000
About This Home
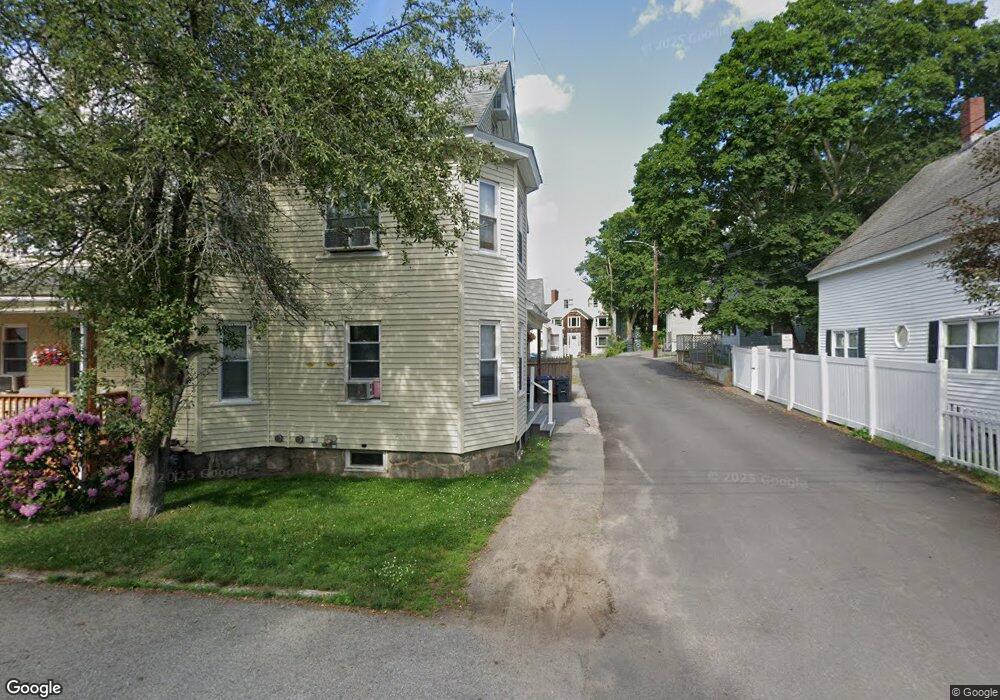
This home is located at 8 Richardson Ct, Methuen, MA 01844 and is currently estimated at $441,158, approximately $463 per square foot. 8 Richardson Ct is a home located in Essex County with nearby schools including Tenney Grammar School, Methuen High School, and The Islamic Academy For Peace.
Ownership History
We collect this data history from publicly available records. To have your information removed, we recommend requesting removal directly through your county’s website.
Purchase Details
Home Values in the Area
Average Home Value in this Area
Purchase History
We collect this data history from publicly available records. To have your information removed, we recommend requesting removal directly through your county’s website.
| Date | Buyer | Sale Price | Title Company |
|---|---|---|---|
| -- | -- |
Mortgage History
We collect this data history from publicly available records. To have your information removed, we recommend requesting removal directly through your county’s website.
| Date | Status | Borrower | Loan Amount |
|---|---|---|---|
| Previous Owner | $25,000 | ||
| Previous Owner | $31,000 | ||
| Previous Owner | $36,000 |
Tax History
We collect this data history from publicly available records. To have your information removed, we recommend requesting removal directly through your county’s website.
| Year | Tax Paid | Tax Assessment Tax Assessment Total Assessment is a certain percentage of the fair market value that is determined by local assessors to be the total taxable value of land and additions on the property. | Land | Improvement |
|---|---|---|---|---|
| 2025 | $4,037 | $381,600 | $188,600 | $193,000 |
| 2024 | $3,913 | $360,300 | $172,000 | $188,300 |
| 2023 | $3,767 | $322,000 | $152,900 | $169,100 |
| 2022 | $3,483 | $266,900 | $121,100 | $145,800 |
| 2021 | $3,288 | $249,300 | $114,700 | $134,600 |
| 2020 | $3,275 | $243,700 | $114,700 | $129,000 |
| 2019 | $2,949 | $207,800 | $94,700 | $113,100 |
| 2018 | $2,815 | $197,300 | $89,100 | $108,200 |
| 2017 | $2,759 | $188,300 | $89,100 | $99,200 |
| 2016 | $2,598 | $175,400 | $78,000 | $97,400 |
Map
- 22 Barker St
- 95 Pelham St Unit 3
- 5 Pearl Ct
- 84 Lowell St
- 7 Goldsmith Ct
- 43-45 Arnold St
- 179-181 Oakland Ave
- 281 Broadway
- 71 Mystic St Unit 11
- 102 Edgewood Ave
- 194 Oakland Ave
- 50-52 Ashland Ave
- 108 Ashland Ave
- 10 Stevens St
- 11 Oakland Ave
- 4 Capitol St
- 10 Summit Ave
- 26 Ponderosa Ave
- 59 Nevins Rd
- 17 Cochrane St
- 8 Barker St
- 8 Barker St Unit 2
- 10 Barker St Unit 2
- 10 Barker St Unit 12
- 4 Barker St
- 12 1/2 Barker St
- 4 Richardson Ct
- 66 Pelham St
- 7 Barker St
- 5 Barker St
- 68 Pelham St
- 68 Pelham St Unit 2
- 11 Barker St
- 3 Barker St
- 58 Pelham St
- 3 Richardson Ct
- 5 Richardson Ct
- 15 Barker St
- 7 Richardson Ct
- 7 Richardson Ct Unit 7
Ask me questions while you tour the home.