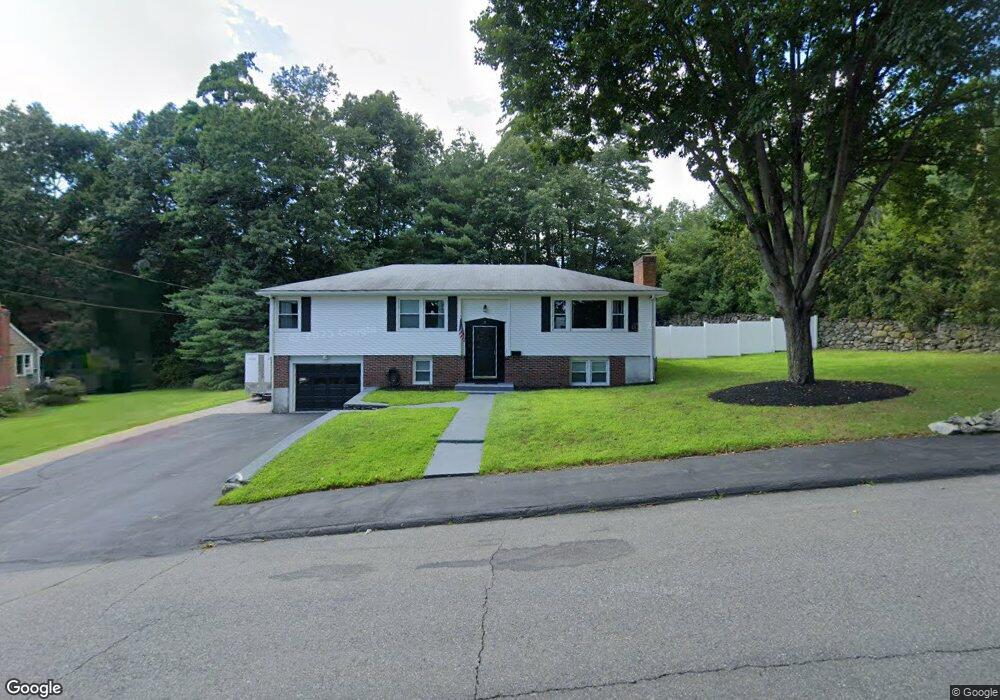
8 Ridge Rd Hudson, MA 01749
Estimated Value: $611,000 - $665,588
3
Beds
3
Baths
1,800
Sq Ft
$350/Sq Ft
Est. Value
About This Home
This home is located at 8 Ridge Rd, Hudson, MA 01749 and is currently estimated at $629,147, approximately $349 per square foot. 8 Ridge Rd is a home located in Middlesex County with nearby schools including David J. Quinn Middle School, Hudson High School, and First Steps Children's Center.
Ownership History
Date
Name
Owned For
Owner Type
Purchase Details
Closed on
Mar 27, 2020
Sold by
Mcalexander Lyxa H
Bought by
Morais Jennifer A and Pereira Joao V
Current Estimated Value
Home Financials for this Owner
Home Financials are based on the most recent Mortgage that was taken out on this home.
Original Mortgage
$373,117
Outstanding Balance
$329,909
Interest Rate
3.3%
Mortgage Type
FHA
Estimated Equity
$299,238
Purchase Details
Closed on
Jan 4, 2007
Sold by
Mayuski Stanley V and Mayuski Susan M
Bought by
Mcalexander Lyxa H
Home Financials for this Owner
Home Financials are based on the most recent Mortgage that was taken out on this home.
Original Mortgage
$263,000
Interest Rate
6.24%
Mortgage Type
Purchase Money Mortgage
Create a Home Valuation Report for This Property
The Home Valuation Report is an in-depth analysis detailing your home's value as well as a comparison with similar homes in the area
Home Values in the Area
Average Home Value in this Area
Purchase History
| Date | Buyer | Sale Price | Title Company |
|---|---|---|---|
| Morais Jennifer A | $380,000 | None Available | |
| Morais Jennifer A | $380,000 | None Available | |
| Mcalexander Lyxa H | $330,500 | -- | |
| Mcalexander Lyxa H | $330,500 | -- |
Source: Public Records
Mortgage History
| Date | Status | Borrower | Loan Amount |
|---|---|---|---|
| Open | Morais Jennifer A | $373,117 | |
| Closed | Morais Jennifer A | $373,117 | |
| Previous Owner | Mcalexander Lyxa H | $259,600 | |
| Previous Owner | Mcalexander Lyxa H | $263,000 | |
| Previous Owner | Mcalexander Lyxa H | $119,000 |
Source: Public Records
Tax History
| Year | Tax Paid | Tax Assessment Tax Assessment Total Assessment is a certain percentage of the fair market value that is determined by local assessors to be the total taxable value of land and additions on the property. | Land | Improvement |
|---|---|---|---|---|
| 2025 | $7,892 | $568,600 | $195,300 | $373,300 |
| 2024 | $7,347 | $524,800 | $177,500 | $347,300 |
| 2023 | $6,840 | $468,500 | $170,700 | $297,800 |
| 2022 | $6,515 | $410,800 | $155,100 | $255,700 |
| 2021 | $6,163 | $371,500 | $147,700 | $223,800 |
| 2020 | $6,121 | $368,500 | $144,700 | $223,800 |
| 2019 | $5,894 | $346,100 | $144,700 | $201,400 |
| 2018 | $4,754 | $312,100 | $137,900 | $174,200 |
| 2017 | $5,516 | $315,200 | $131,400 | $183,800 |
| 2016 | $5,090 | $294,400 | $131,400 | $163,000 |
| 2015 | $4,729 | $273,800 | $131,400 | $142,400 |
| 2014 | $4,397 | $252,400 | $115,300 | $137,100 |
Source: Public Records
Map
Nearby Homes
- 3 Gerry Dr Unit 15
- 136 Central St Unit C6
- 133 Lincoln St
- 2 Barracks Rd Unit 2
- 3 Highland Park Ave
- 25 Richard Rd
- 4 Linden St
- 128 Manning St
- 200 Manning St Unit 20A
- 200 Manning St Unit 6B
- 21 Felton St
- 46 Church St Unit 2
- 110 River St
- 315 Central St
- 17 School St Unit C
- 17 School St Unit A
- 168 River Rd E Unit Lot 15A
- 168 River Rd E Unit Lot 5
- 168 River Rd E Unit Lot 3
- 168 River Rd E Unit Lot 11
Your Personal Tour Guide
Ask me questions while you tour the home.