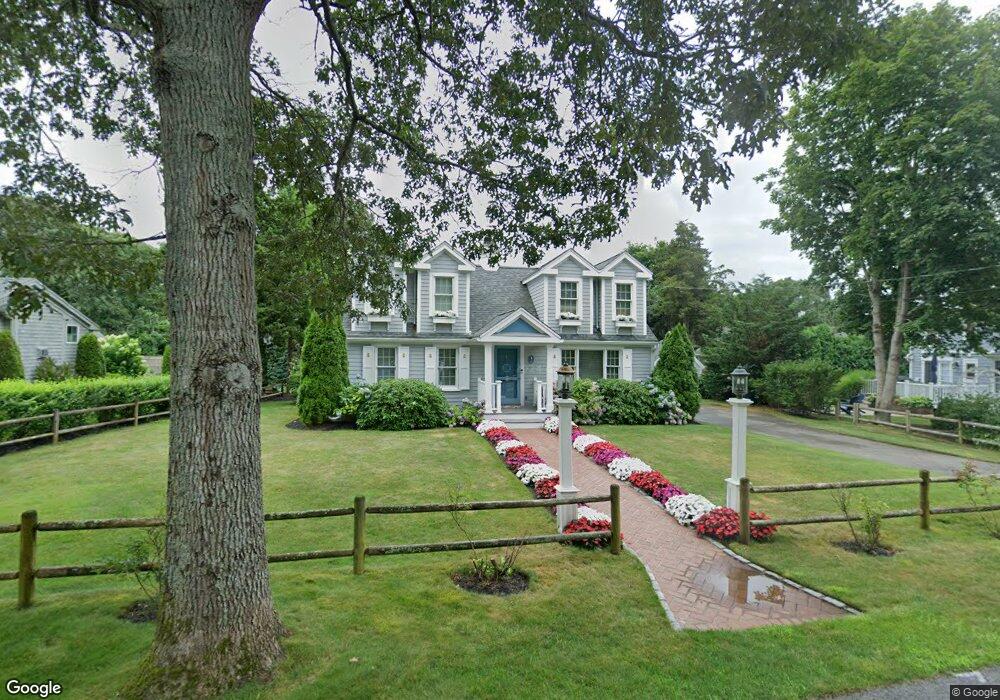
8 Robin Ln Pocasset, MA 02559
Pocasset NeighborhoodEstimated Value: $639,000 - $1,707,000
5
Beds
2
Baths
1,638
Sq Ft
$694/Sq Ft
Est. Value
About This Home
This home is located at 8 Robin Ln, Pocasset, MA 02559 and is currently estimated at $1,136,124, approximately $693 per square foot. 8 Robin Ln is a home located in Barnstable County with nearby schools including Bourne High School and Cadence Academy Preschool - Bourne.
Ownership History
Date
Name
Owned For
Owner Type
Purchase Details
Closed on
Aug 24, 2011
Sold by
Mary S Quartermain 200 S and Mary Wilson
Bought by
Boulanger Albert and Boulanger Diane
Current Estimated Value
Purchase Details
Closed on
Aug 9, 2007
Sold by
Mary S Quartermain T
Bought by
Mary S Quartermain T
Home Financials for this Owner
Home Financials are based on the most recent Mortgage that was taken out on this home.
Original Mortgage
$139,740
Interest Rate
6.72%
Mortgage Type
Purchase Money Mortgage
Create a Home Valuation Report for This Property
The Home Valuation Report is an in-depth analysis detailing your home's value as well as a comparison with similar homes in the area
Home Values in the Area
Average Home Value in this Area
Purchase History
| Date | Buyer | Sale Price | Title Company |
|---|---|---|---|
| Boulanger Albert | $582,000 | -- | |
| Mary S Quartermain T | $161,000 | -- | |
| Gersten Alison Q | -- | -- | |
| Boulanger Albert | $582,000 | -- | |
| Mary S Quartermain T S | $161,000 | -- | |
| Gersten Alison Q | -- | -- | |
| Gersten Alison Q | -- | -- |
Source: Public Records
Mortgage History
| Date | Status | Borrower | Loan Amount |
|---|---|---|---|
| Previous Owner | Gersten Alison Q | $139,740 |
Source: Public Records
Tax History Compared to Growth
Tax History
| Year | Tax Paid | Tax Assessment Tax Assessment Total Assessment is a certain percentage of the fair market value that is determined by local assessors to be the total taxable value of land and additions on the property. | Land | Improvement |
|---|---|---|---|---|
| 2025 | $7,111 | $910,500 | $460,800 | $449,700 |
| 2024 | $6,670 | $831,700 | $438,900 | $392,800 |
| 2023 | $6,074 | $689,400 | $341,800 | $347,600 |
| 2022 | $5,492 | $544,300 | $268,100 | $276,200 |
| 2021 | $5,339 | $495,700 | $244,000 | $251,700 |
| 2020 | $4,911 | $457,300 | $241,700 | $215,600 |
| 2019 | $4,679 | $445,200 | $241,700 | $203,500 |
| 2018 | $4,531 | $429,900 | $236,100 | $193,800 |
| 2017 | $4,691 | $455,400 | $257,300 | $198,100 |
| 2016 | $4,334 | $426,600 | $233,900 | $192,700 |
| 2015 | $4,296 | $426,600 | $233,900 | $192,700 |
Source: Public Records
Map
Nearby Homes