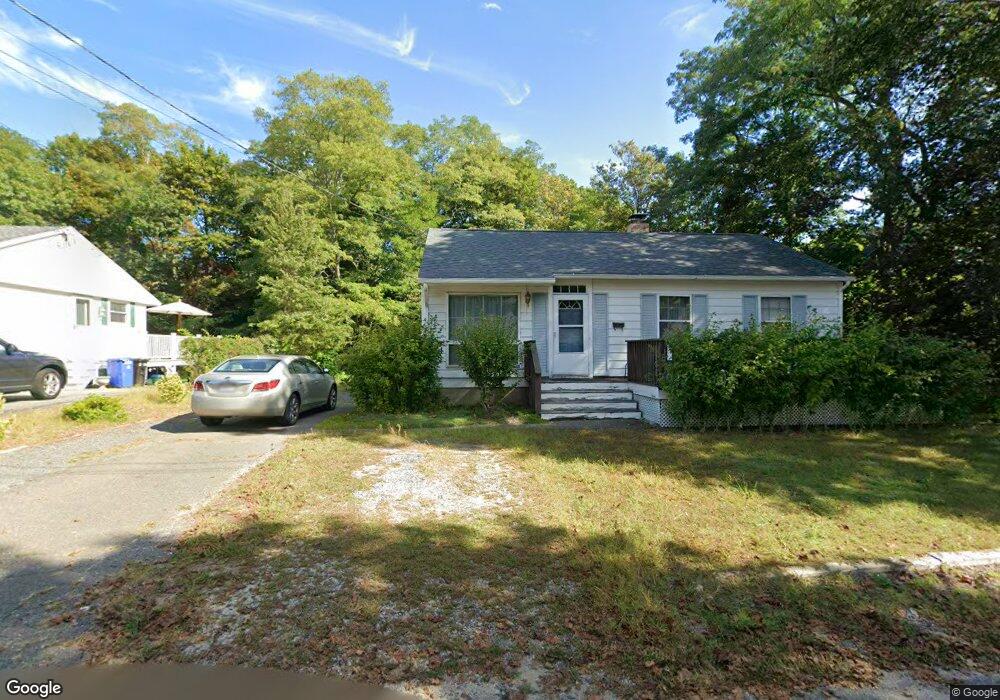
8 Ronna Rd Gloucester, MA 01930
Riverview NeighborhoodEstimated Value: $663,000 - $875,794
3
Beds
--
Bath
2,044
Sq Ft
$375/Sq Ft
Est. Value
About This Home
This home is located at 8 Ronna Rd, Gloucester, MA 01930 and is currently estimated at $765,949, approximately $374 per square foot. 8 Ronna Rd is a home located in Essex County with nearby schools including Beeman Memorial, Ralph B O'maley Middle School, and Gloucester High School.
Ownership History
Date
Name
Owned For
Owner Type
Purchase Details
Closed on
Dec 14, 2010
Sold by
Testaverde Mary G and Testaverde Gina M
Bought by
Fennessey Gina M and Fennessey Brendan M
Current Estimated Value
Home Financials for this Owner
Home Financials are based on the most recent Mortgage that was taken out on this home.
Original Mortgage
$310,000
Outstanding Balance
$205,019
Interest Rate
4.24%
Mortgage Type
Purchase Money Mortgage
Estimated Equity
$560,930
Purchase Details
Closed on
Mar 31, 2005
Sold by
Fennessey Gina M and Testaverde Mary G
Bought by
Testaverde Mary G
Home Financials for this Owner
Home Financials are based on the most recent Mortgage that was taken out on this home.
Original Mortgage
$280,000
Interest Rate
5.61%
Purchase Details
Closed on
May 8, 2002
Sold by
Herrick Paul M and Herrick Bessie
Bought by
Testaverde Mary G and Fennessey Gina M
Create a Home Valuation Report for This Property
The Home Valuation Report is an in-depth analysis detailing your home's value as well as a comparison with similar homes in the area
Home Values in the Area
Average Home Value in this Area
Purchase History
| Date | Buyer | Sale Price | Title Company |
|---|---|---|---|
| Fennessey Gina M | $25,000 | -- | |
| Testaverde Mary G | -- | -- | |
| Testaverde Mary G | $236,000 | -- |
Source: Public Records
Mortgage History
| Date | Status | Borrower | Loan Amount |
|---|---|---|---|
| Open | Testaverde Mary G | $310,000 | |
| Previous Owner | Testaverde Mary G | $280,000 | |
| Previous Owner | Testaverde Mary G | $300,000 |
Source: Public Records
Tax History
| Year | Tax Paid | Tax Assessment Tax Assessment Total Assessment is a certain percentage of the fair market value that is determined by local assessors to be the total taxable value of land and additions on the property. | Land | Improvement |
|---|---|---|---|---|
| 2025 | $7,236 | $744,400 | $258,400 | $486,000 |
| 2024 | $7,122 | $732,000 | $246,000 | $486,000 |
| 2023 | $7,547 | $712,700 | $219,700 | $493,000 |
| 2022 | $6,800 | $579,700 | $186,800 | $392,900 |
| 2021 | $6,566 | $527,800 | $169,800 | $358,000 |
| 2020 | $6,516 | $528,500 | $169,800 | $358,700 |
| 2019 | $6,109 | $481,400 | $169,800 | $311,600 |
| 2018 | $5,745 | $444,300 | $169,800 | $274,500 |
| 2017 | $5,492 | $416,400 | $161,700 | $254,700 |
| 2016 | $5,315 | $390,500 | $162,200 | $228,300 |
| 2015 | $5,231 | $383,200 | $162,200 | $221,000 |
Source: Public Records
Map
Nearby Homes
- 13 Honeysuckle Rd
- 3 Deacon Farm Ln
- 31 Echo Ave
- 2 Breezy Point Rd
- 13 Mystic Ave
- 8 Mystic Ave
- 6 Monroe Ct
- 98 Maplewood Ave
- 672 Washington St
- 9 Cleveland Place
- 12 Arthur St
- 167 Atlantic St
- 178 Atlantic St
- 40 Sargent St
- 15 Harvard St
- 145 Essex Ave Unit 402
- 33 Maplewood Ave Unit 310
- 19 Trask St Unit 2
- 113 Pleasant St
- 50 Warner St
Your Personal Tour Guide
Ask me questions while you tour the home.