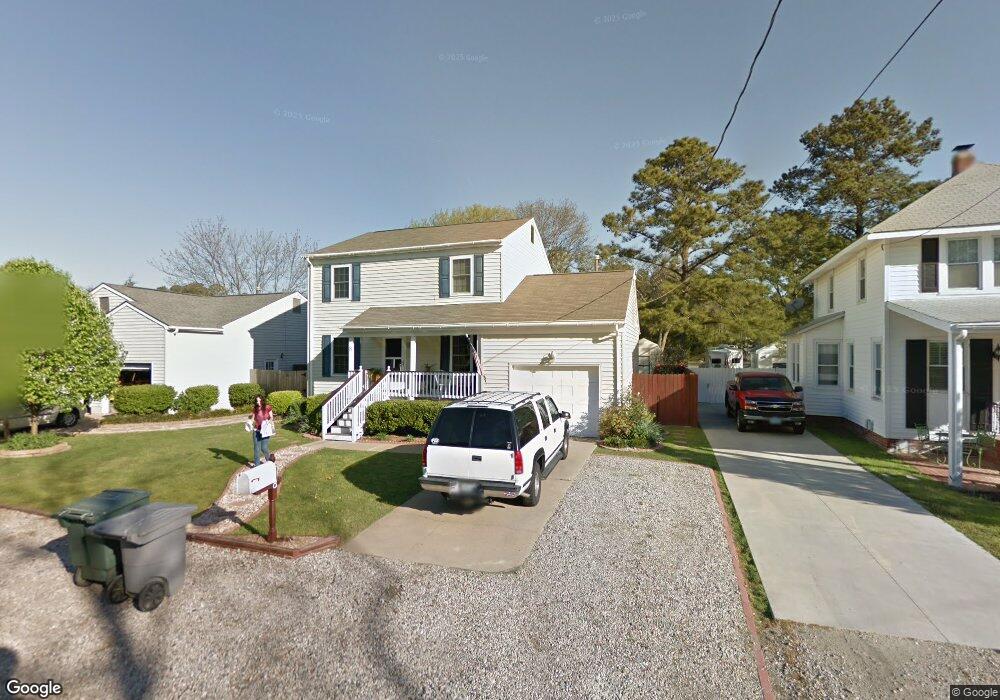
8 Routten Rd Hampton, VA 23664
Fox Hill NeighborhoodEstimated Value: $307,285 - $415,000
3
Beds
3
Baths
1,547
Sq Ft
$225/Sq Ft
Est. Value
About This Home
This home is located at 8 Routten Rd, Hampton, VA 23664 and is currently estimated at $347,571, approximately $224 per square foot. 8 Routten Rd is a home located in Hampton City with nearby schools including Francis Asbury Elementary School, Benjamin Syms Middle School, and Kecoughtan High School.
Ownership History
Date
Name
Owned For
Owner Type
Purchase Details
Closed on
Sep 30, 2013
Sold by
Williams Nathan A
Bought by
Stocker Amy M
Current Estimated Value
Home Financials for this Owner
Home Financials are based on the most recent Mortgage that was taken out on this home.
Original Mortgage
$184,500
Outstanding Balance
$139,228
Interest Rate
4.61%
Mortgage Type
New Conventional
Estimated Equity
$208,343
Purchase Details
Closed on
Jul 14, 2006
Sold by
Raisor Phillip W
Bought by
Williams Nathan A
Home Financials for this Owner
Home Financials are based on the most recent Mortgage that was taken out on this home.
Original Mortgage
$192,400
Interest Rate
6.71%
Mortgage Type
New Conventional
Purchase Details
Closed on
Sep 2, 2000
Sold by
Spratt Stephen
Bought by
Raison Phillip
Home Financials for this Owner
Home Financials are based on the most recent Mortgage that was taken out on this home.
Original Mortgage
$126,350
Interest Rate
8.1%
Create a Home Valuation Report for This Property
The Home Valuation Report is an in-depth analysis detailing your home's value as well as a comparison with similar homes in the area
Home Values in the Area
Average Home Value in this Area
Purchase History
| Date | Buyer | Sale Price | Title Company |
|---|---|---|---|
| Stocker Amy M | $205,000 | -- | |
| Williams Nathan A | $192,400 | -- | |
| Raison Phillip | $123,900 | -- |
Source: Public Records
Mortgage History
| Date | Status | Borrower | Loan Amount |
|---|---|---|---|
| Open | Stocker Amy M | $184,500 | |
| Previous Owner | Williams Nathan A | $192,400 | |
| Previous Owner | Raison Phillip | $126,350 |
Source: Public Records
Tax History
| Year | Tax Paid | Tax Assessment Tax Assessment Total Assessment is a certain percentage of the fair market value that is determined by local assessors to be the total taxable value of land and additions on the property. | Land | Improvement |
|---|---|---|---|---|
| 2025 | $3,454 | $294,200 | $44,700 | $249,500 |
| 2024 | $3,259 | $283,400 | $44,700 | $238,700 |
| 2023 | $3,163 | $272,700 | $44,700 | $228,000 |
| 2022 | $2,640 | $223,700 | $44,700 | $179,000 |
| 2021 | $2,565 | $196,400 | $44,700 | $151,700 |
| 2020 | $2,416 | $194,800 | $44,700 | $150,100 |
| 2019 | $2,416 | $194,800 | $44,700 | $150,100 |
| 2018 | $2,509 | $194,800 | $44,700 | $150,100 |
| 2017 | $2,509 | $0 | $0 | $0 |
| 2016 | $2,509 | $194,800 | $0 | $0 |
| 2015 | $2,509 | $0 | $0 | $0 |
| 2014 | $2,290 | $194,800 | $44,700 | $150,100 |
Source: Public Records
Map
Nearby Homes