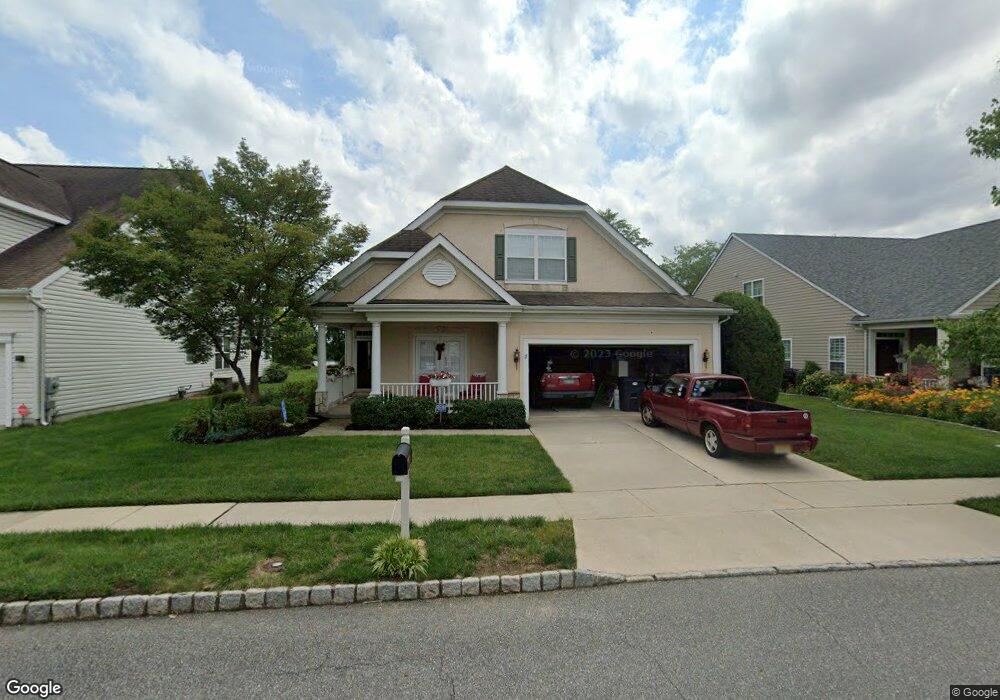
8 Russ Farm Way Riverside, NJ 08075
Estimated Value: $510,000 - $570,000
3
Beds
3
Baths
2,299
Sq Ft
$233/Sq Ft
Est. Value
About This Home
This home is located at 8 Russ Farm Way, Riverside, NJ 08075 and is currently estimated at $536,514, approximately $233 per square foot. 8 Russ Farm Way is a home located in Burlington County with nearby schools including M. Joan Pearson Elementary School, Walnut Street Middle School, and Cathedral of Love Christian School.
Ownership History
Date
Name
Owned For
Owner Type
Purchase Details
Closed on
Jan 25, 2017
Sold by
Cincotta Walter F
Bought by
Blackeby Rinald C and Blackeby Phyllis B
Current Estimated Value
Home Financials for this Owner
Home Financials are based on the most recent Mortgage that was taken out on this home.
Original Mortgage
$75,000
Outstanding Balance
$62,270
Interest Rate
4.3%
Mortgage Type
New Conventional
Estimated Equity
$474,244
Purchase Details
Closed on
Apr 15, 2010
Sold by
Brocco Anne and Willitts Rosanne
Bought by
Cincotta Walter F and Cincotta Barbara
Purchase Details
Closed on
Jul 31, 2002
Sold by
Pulte Homes Of Nj Ltd Partnership
Bought by
Brocco Anne and Willitts Rosanne
Home Financials for this Owner
Home Financials are based on the most recent Mortgage that was taken out on this home.
Original Mortgage
$208,000
Interest Rate
6.2%
Create a Home Valuation Report for This Property
The Home Valuation Report is an in-depth analysis detailing your home's value as well as a comparison with similar homes in the area
Home Values in the Area
Average Home Value in this Area
Purchase History
| Date | Buyer | Sale Price | Title Company |
|---|---|---|---|
| Blackeby Rinald C | $302,000 | Surety Title Co | |
| Cincotta Walter F | $360,000 | Foundation Title | |
| Brocco Anne | $262,700 | Surety Title Corporation |
Source: Public Records
Mortgage History
| Date | Status | Borrower | Loan Amount |
|---|---|---|---|
| Open | Blackeby Rinald C | $75,000 | |
| Previous Owner | Brocco Anne | $208,000 |
Source: Public Records
Tax History Compared to Growth
Tax History
| Year | Tax Paid | Tax Assessment Tax Assessment Total Assessment is a certain percentage of the fair market value that is determined by local assessors to be the total taxable value of land and additions on the property. | Land | Improvement |
|---|---|---|---|---|
| 2025 | $9,840 | $279,700 | $63,100 | $216,600 |
| 2024 | $9,871 | $279,700 | $63,100 | $216,600 |
| 2023 | $9,871 | $279,700 | $63,100 | $216,600 |
| 2022 | $9,644 | $279,700 | $63,100 | $216,600 |
| 2021 | $8,484 | $279,700 | $63,100 | $216,600 |
| 2020 | $9,465 | $279,700 | $63,100 | $216,600 |
| 2019 | $9,202 | $279,700 | $63,100 | $216,600 |
| 2018 | $9,018 | $279,700 | $63,100 | $216,600 |
| 2017 | $8,847 | $279,700 | $63,100 | $216,600 |
| 2016 | $8,587 | $279,700 | $63,100 | $216,600 |
| 2015 | $8,444 | $279,700 | $63,100 | $216,600 |
| 2014 | $8,232 | $279,700 | $63,100 | $216,600 |
Source: Public Records
Map
Nearby Homes
- 11 Mccay Way
- 15 Mccay Way
- 77 Pennington Ct
- 29 Pennington Ct
- 0 Pennsylvania Ave
- 820 Laurel St
- 635 Laurel St
- 512 Spruce St
- 601 Creek
- 719 Hickory St
- 229 Filmore St
- 719 Burlington Ave
- 649 Bridgeboro St
- 514 Bridgeboro St
- 506 Bridgeboro St
- 307 Burlington Ave
- 418 Delview Ln
- 323 Walnut St
- 304 Clay St
- 224 E Washington St
- 10 Russ Farm Way
- 6 Russ Farm Way
- 12 Russ Farm Way
- 4 Russ Farm Way
- 7 Russ Farm Way
- 9 Russ Farm Way
- 5 Russ Farm Way
- 2 Russ Farm Way
- 11 Russ Farm Way
- 3 Russ Farm Way
- 100 Russ Farm Way
- 1 Russ Farm Way
- 12 Mccay Way
- 10 Mccay Way
- 14 Mccay Way
- 15 Russ Farm Way
- 16 Mccay Way
- 6 Mccay Way
- 4 Mccay Way
- 17 Russ Farm Way