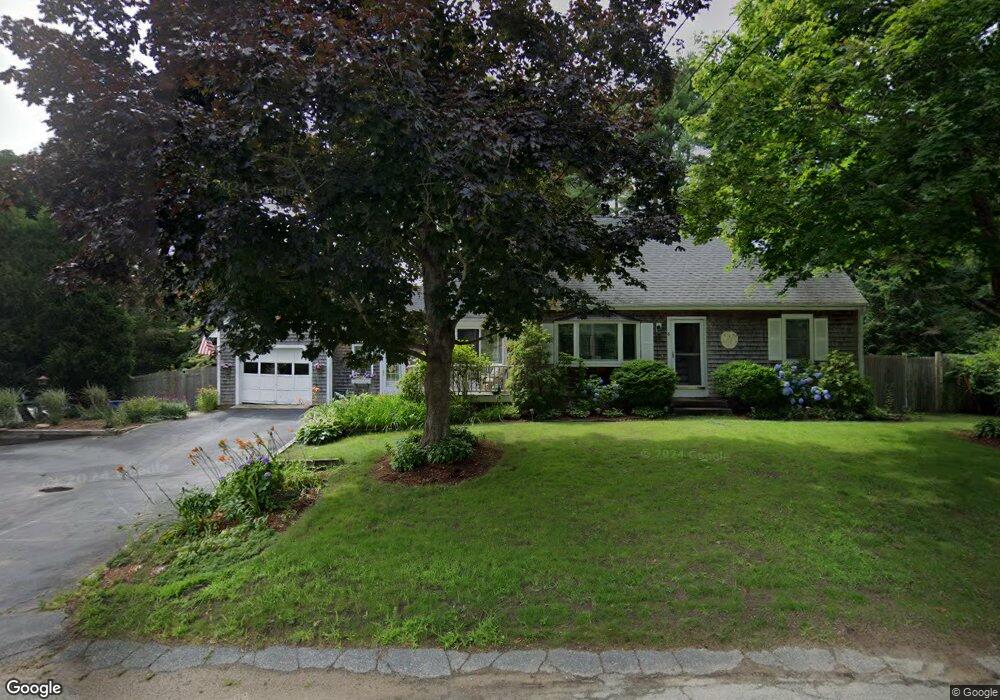
8 Sabbatt Rd Pocasset, MA 02559
Pocasset NeighborhoodEstimated Value: $541,000 - $630,000
2
Beds
2
Baths
1,548
Sq Ft
$370/Sq Ft
Est. Value
About This Home
This home is located at 8 Sabbatt Rd, Pocasset, MA 02559 and is currently estimated at $573,308, approximately $370 per square foot. 8 Sabbatt Rd is a home located in Barnstable County with nearby schools including Bourne High School, Cadence Academy Preschool - Bourne, and St Margaret Regional School.
Ownership History
Date
Name
Owned For
Owner Type
Purchase Details
Closed on
Oct 19, 1990
Sold by
Polcari John D
Bought by
Johnson Joseph M
Current Estimated Value
Purchase Details
Closed on
Sep 14, 1988
Sold by
Nodic Patrick J
Bought by
Polcari John D
Create a Home Valuation Report for This Property
The Home Valuation Report is an in-depth analysis detailing your home's value as well as a comparison with similar homes in the area
Home Values in the Area
Average Home Value in this Area
Purchase History
| Date | Buyer | Sale Price | Title Company |
|---|---|---|---|
| Johnson Joseph M | $124,000 | -- | |
| Johnson Joseph M | $124,000 | -- | |
| Polcari John D | $130,000 | -- |
Source: Public Records
Mortgage History
| Date | Status | Borrower | Loan Amount |
|---|---|---|---|
| Open | Polcari John D | $118,000 | |
| Closed | Polcari John D | $64,984 | |
| Closed | Polcari John D | $113,900 |
Source: Public Records
Tax History Compared to Growth
Tax History
| Year | Tax Paid | Tax Assessment Tax Assessment Total Assessment is a certain percentage of the fair market value that is determined by local assessors to be the total taxable value of land and additions on the property. | Land | Improvement |
|---|---|---|---|---|
| 2025 | $4,089 | $523,500 | $195,300 | $328,200 |
| 2024 | $4,158 | $518,500 | $202,900 | $315,600 |
| 2023 | $4,044 | $459,000 | $179,600 | $279,400 |
| 2022 | $3,710 | $367,700 | $145,700 | $222,000 |
| 2021 | $3,634 | $337,400 | $132,600 | $204,800 |
| 2020 | $3,419 | $318,300 | $131,300 | $187,000 |
| 2019 | $3,236 | $307,900 | $131,300 | $176,600 |
| 2018 | $3,151 | $299,000 | $130,700 | $168,300 |
| 2017 | $2,939 | $285,300 | $129,500 | $155,800 |
| 2016 | $2,825 | $278,100 | $129,500 | $148,600 |
| 2015 | $2,404 | $238,700 | $90,100 | $148,600 |
Source: Public Records
Map
Nearby Homes
- 7 Portside Dr
- 7 4th Ave
- 15 1st St
- 174 Barlows Landing Rd
- 940 County Rd
- 709 County Rd
- 940 County Rd
- 254 Barlows Landing Rd
- 39 Bennets Neck Dr
- 1094 County Rd
- 3 Red Brook Pond Dr
- 515 County Rd
- 171 Bellavista Dr
- 16 Tara Terrace
- 501 County Rd
- 48 Red Brook Harbor Rd
- 22 Nairn Rd
- 14 Navajo Rd
- 1234 Route 28a
- 30 Howard Ave