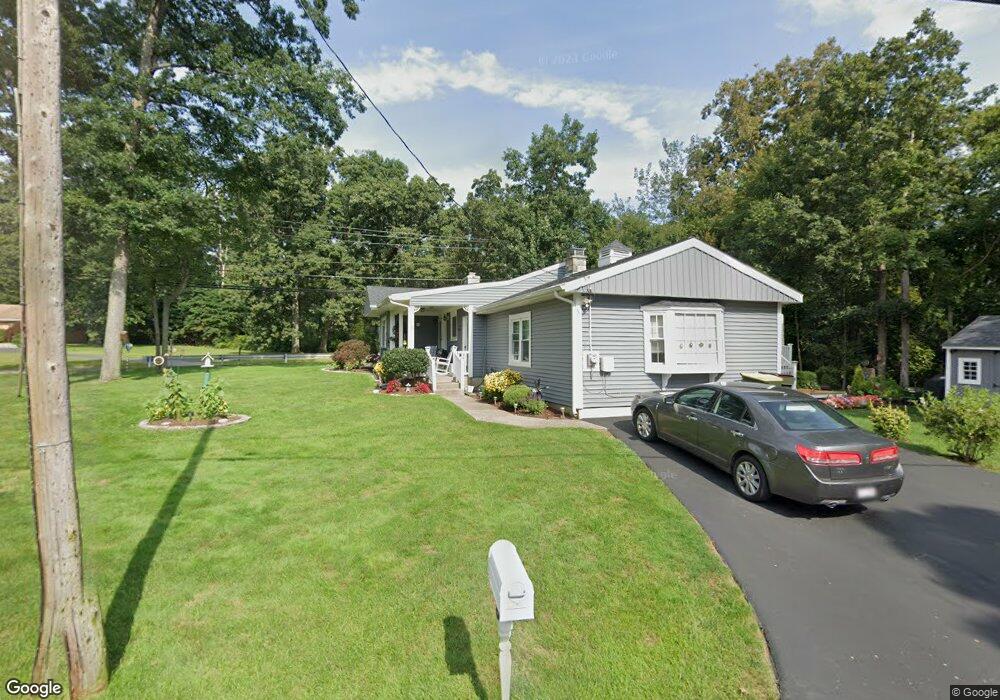
8 Scott St Bellingham, MA 02019
Estimated Value: $429,338 - $497,000
2
Beds
1
Bath
1,484
Sq Ft
$317/Sq Ft
Est. Value
About This Home
This home is located at 8 Scott St, Bellingham, MA 02019 and is currently estimated at $470,585, approximately $317 per square foot. 8 Scott St is a home located in Norfolk County with nearby schools including Joseph F. DiPietro Elementary, Bellingham High School, and Rise Prep Mayoral Academy Middle School.
Ownership History
Date
Name
Owned For
Owner Type
Purchase Details
Closed on
Jul 31, 2008
Sold by
Berry Beverly R and Fox William J
Bought by
Nichols Mary and Marinilli Robert D
Current Estimated Value
Home Financials for this Owner
Home Financials are based on the most recent Mortgage that was taken out on this home.
Original Mortgage
$204,786
Outstanding Balance
$135,327
Interest Rate
6.47%
Mortgage Type
Purchase Money Mortgage
Estimated Equity
$335,258
Purchase Details
Closed on
Oct 30, 1998
Sold by
Berry Norman J and Berry Beverly R
Bought by
Citizens Bk Rhode Isln
Create a Home Valuation Report for This Property
The Home Valuation Report is an in-depth analysis detailing your home's value as well as a comparison with similar homes in the area
Home Values in the Area
Average Home Value in this Area
Purchase History
| Date | Buyer | Sale Price | Title Company |
|---|---|---|---|
| Nichols Mary | $208,000 | -- | |
| Citizens Bk Rhode Isln | $41,000 | -- |
Source: Public Records
Mortgage History
| Date | Status | Borrower | Loan Amount |
|---|---|---|---|
| Open | Nichols Mary | $204,786 | |
| Previous Owner | Citizens Bk Rhode Isln | $34,000 | |
| Previous Owner | Citizens Bk Rhode Isln | $30,000 |
Source: Public Records
Tax History
| Year | Tax Paid | Tax Assessment Tax Assessment Total Assessment is a certain percentage of the fair market value that is determined by local assessors to be the total taxable value of land and additions on the property. | Land | Improvement |
|---|---|---|---|---|
| 2025 | $4,404 | $350,600 | $131,600 | $219,000 |
| 2024 | $4,237 | $329,500 | $120,200 | $209,300 |
| 2023 | $4,083 | $312,900 | $114,400 | $198,500 |
| 2022 | $3,996 | $283,800 | $95,400 | $188,400 |
| 2021 | $3,859 | $267,800 | $95,400 | $172,400 |
| 2020 | $3,626 | $255,000 | $95,400 | $159,600 |
| 2019 | $3,543 | $249,300 | $95,400 | $153,900 |
| 2018 | $3,362 | $233,300 | $96,300 | $137,000 |
| 2017 | $3,277 | $228,500 | $96,000 | $132,500 |
| 2016 | $3,177 | $222,300 | $99,900 | $122,400 |
| 2015 | $3,047 | $213,800 | $96,000 | $117,800 |
| 2014 | $2,926 | $199,600 | $92,700 | $106,900 |
Source: Public Records
Map
Nearby Homes
- 31 Whitehall Way
- 11 Quail Run Rd
- 22 Pine Warbler Way
- 70 Oswego St
- 101 Pine Grove Ave
- 855 S Main St
- 133 Lakeshore Dr
- 0 North St Unit 73440626
- Lot 4 Pickering Rd
- Lot 1 Pickering Rd
- Lot 3 Pickering Rd
- 31 Lilac Ave
- 194 Paine St
- Lot 2 Pulaski Blvd
- 202 Paine St
- 4 Cypress Cir Unit 4
- 25 Palmetto Dr Unit 25
- 21 Palmetto Dr Unit 21
- 33 Achille St
- 1088 Diamond Hill Rd
Your Personal Tour Guide
Ask me questions while you tour the home.