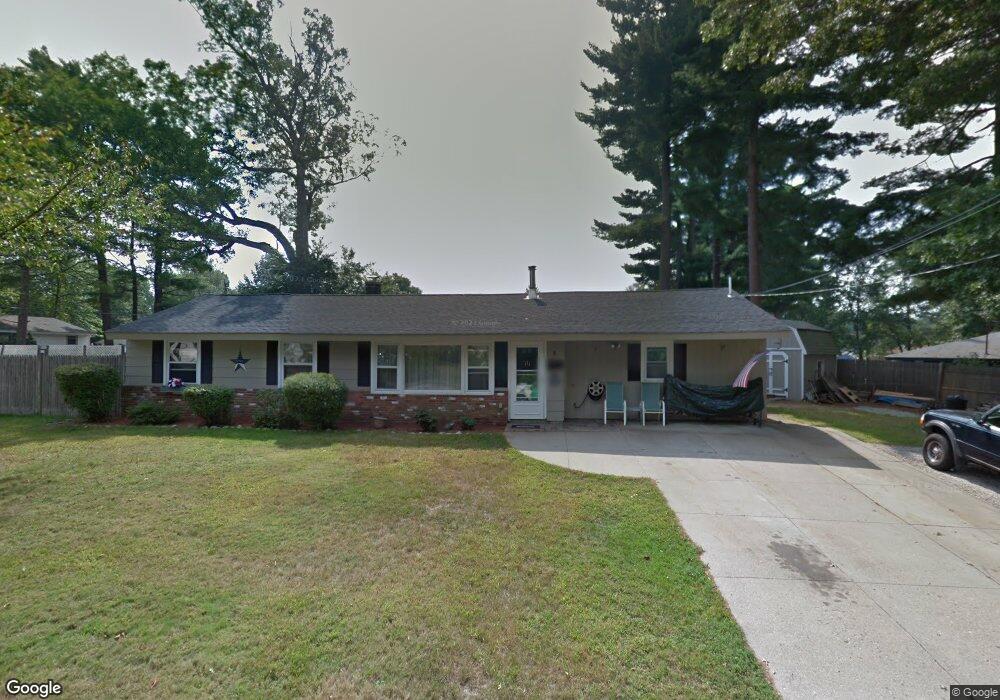
8 Sheila Dr Bellingham, MA 02019
Estimated Value: $449,934 - $504,000
3
Beds
1
Bath
1,404
Sq Ft
$336/Sq Ft
Est. Value
About This Home
This home is located at 8 Sheila Dr, Bellingham, MA 02019 and is currently estimated at $471,484, approximately $335 per square foot. 8 Sheila Dr is a home located in Norfolk County with nearby schools including Stall Brook Elementary School, Bellingham High School, and Bethany Christian Academy.
Ownership History
Date
Name
Owned For
Owner Type
Purchase Details
Closed on
Jan 14, 2022
Sold by
Pender John J and Pender Deanna M
Bought by
Pender Ft and Pender
Current Estimated Value
Purchase Details
Closed on
Oct 28, 1992
Sold by
Mccarthy Paul V and Mccarthy Susan M
Bought by
Pender John J
Purchase Details
Closed on
Sep 22, 1989
Sold by
Carnell Charles N
Bought by
Mccarthy Paul
Purchase Details
Closed on
Aug 20, 1987
Sold by
Wirtz Gerald J
Bought by
Carnell Charles N
Create a Home Valuation Report for This Property
The Home Valuation Report is an in-depth analysis detailing your home's value as well as a comparison with similar homes in the area
Home Values in the Area
Average Home Value in this Area
Purchase History
| Date | Buyer | Sale Price | Title Company |
|---|---|---|---|
| Pender Ft | -- | None Available | |
| Pender John J | $110,000 | -- | |
| Pender John J | $110,000 | -- | |
| Mccarthy Paul | $127,000 | -- | |
| Mccarthy Paul V | $127,000 | -- | |
| Carnell Charles N | $116,000 | -- |
Source: Public Records
Mortgage History
| Date | Status | Borrower | Loan Amount |
|---|---|---|---|
| Previous Owner | Carnell Charles N | $231,997 | |
| Previous Owner | Carnell Charles N | $205,500 |
Source: Public Records
Tax History
| Year | Tax Paid | Tax Assessment Tax Assessment Total Assessment is a certain percentage of the fair market value that is determined by local assessors to be the total taxable value of land and additions on the property. | Land | Improvement |
|---|---|---|---|---|
| 2025 | $4,543 | $361,700 | $165,400 | $196,300 |
| 2024 | $4,344 | $337,800 | $151,000 | $186,800 |
| 2023 | $4,188 | $320,900 | $143,800 | $177,100 |
| 2022 | $4,055 | $288,000 | $119,900 | $168,100 |
| 2021 | $3,954 | $274,400 | $119,900 | $154,500 |
| 2020 | $3,774 | $265,400 | $119,900 | $145,500 |
| 2019 | $3,692 | $259,800 | $119,900 | $139,900 |
| 2018 | $3,450 | $239,400 | $115,300 | $124,100 |
| 2017 | $3,360 | $234,300 | $115,300 | $119,000 |
| 2016 | $3,207 | $224,400 | $113,400 | $111,000 |
| 2015 | $3,075 | $215,800 | $109,000 | $106,800 |
| 2014 | $3,082 | $210,200 | $106,500 | $103,700 |
Source: Public Records
Map
Nearby Homes
- 95 Lisa Ann Dr
- 48 Donna Rd
- 67 Jeannine Rd
- 60 Wethersfield Rd
- 0 Hixon St Unit 73477486
- 23 Bellwood Cir Unit 23
- 7 Palmetto Dr Unit 7
- 0 Hartford Ave
- 123-125 Mendon St
- 34 Bellwood Cir Unit 34
- 6 Barrows Rd
- 1 Evergreen Dr Unit 1
- 21 Maple St
- 67 Blackstone St
- 17 Pine St
- 3003 Maple Brook Rd Unit 3003
- 125 Blackstone St
- 267 R S Main St
- 267 F S Main St
- 279 S Main St
Your Personal Tour Guide
Ask me questions while you tour the home.