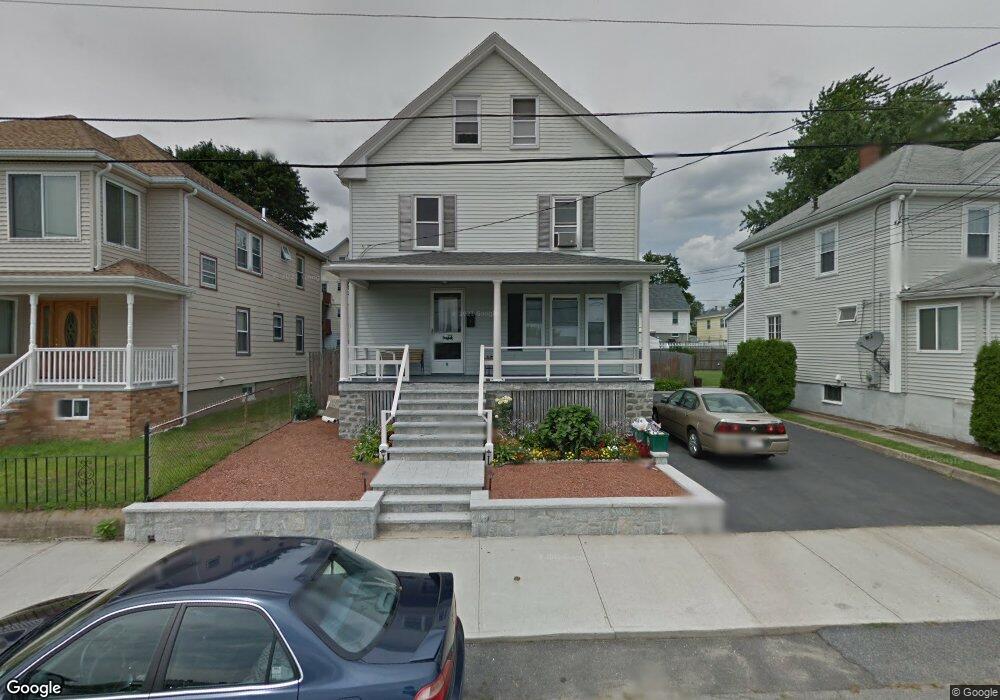
8 Sheldon Rd Peabody, MA 01960
Peabody Town Center NeighborhoodEstimated Value: $682,772 - $823,000
4
Beds
2
Baths
2,048
Sq Ft
$363/Sq Ft
Est. Value
About This Home
This home is located at 8 Sheldon Rd, Peabody, MA 01960 and is currently estimated at $744,443, approximately $363 per square foot. 8 Sheldon Rd is a home located in Essex County with nearby schools including Peabody Veterans Memorial High School, St John The Baptist School, and The Phoenix School.
Ownership History
Date
Name
Owned For
Owner Type
Purchase Details
Closed on
Nov 23, 1999
Sold by
Pramas William and Pramas Ellen N
Bought by
Candido Emanuel F and Candido Kerry A
Current Estimated Value
Home Financials for this Owner
Home Financials are based on the most recent Mortgage that was taken out on this home.
Original Mortgage
$100,000
Interest Rate
7.76%
Mortgage Type
Purchase Money Mortgage
Create a Home Valuation Report for This Property
The Home Valuation Report is an in-depth analysis detailing your home's value as well as a comparison with similar homes in the area
Home Values in the Area
Average Home Value in this Area
Purchase History
| Date | Buyer | Sale Price | Title Company |
|---|---|---|---|
| Candido Emanuel F | $180,000 | -- |
Source: Public Records
Mortgage History
| Date | Status | Borrower | Loan Amount |
|---|---|---|---|
| Open | Candido Emanuel F | $150,000 | |
| Closed | Candido Emanuel F | $80,000 | |
| Closed | Candido Emanuel F | $70,000 | |
| Closed | Candido Emanuel F | $100,000 |
Source: Public Records
Tax History
| Year | Tax Paid | Tax Assessment Tax Assessment Total Assessment is a certain percentage of the fair market value that is determined by local assessors to be the total taxable value of land and additions on the property. | Land | Improvement |
|---|---|---|---|---|
| 2025 | $5,574 | $601,900 | $220,000 | $381,900 |
| 2024 | $5,528 | $606,100 | $220,000 | $386,100 |
| 2023 | $5,130 | $538,900 | $196,500 | $342,400 |
| 2022 | $4,626 | $458,000 | $175,500 | $282,500 |
| 2021 | $4,169 | $397,400 | $159,500 | $237,900 |
| 2020 | $4,263 | $396,900 | $159,500 | $237,400 |
| 2019 | $4,324 | $392,700 | $159,500 | $233,200 |
| 2018 | $3,667 | $320,000 | $145,000 | $175,000 |
| 2017 | $3,562 | $302,900 | $145,000 | $157,900 |
| 2016 | $3,640 | $305,400 | $145,000 | $160,400 |
| 2015 | $3,242 | $263,600 | $141,400 | $122,200 |
Source: Public Records
Map
Nearby Homes
- 30 Driscoll St
- 9 Highland St
- 41 Northend St
- 16 Oakland St
- 16 Tremont St
- 75 Walnut St Unit 315
- 46 Walnut St
- 40 Buffum St Unit 2
- 40 Buffum St Unit 1
- 11 A Endicott St Unit 3
- 44 Orne St Unit 44
- 21 Manning St
- 145 Boston St
- 10 Park St
- 128 Boston St Unit 4
- 8 Crowninshield St Unit 410
- 41 Dearborn St
- 112 North St
- 86 Flint St
- 10 Crowninshield St Unit 303
Your Personal Tour Guide
Ask me questions while you tour the home.