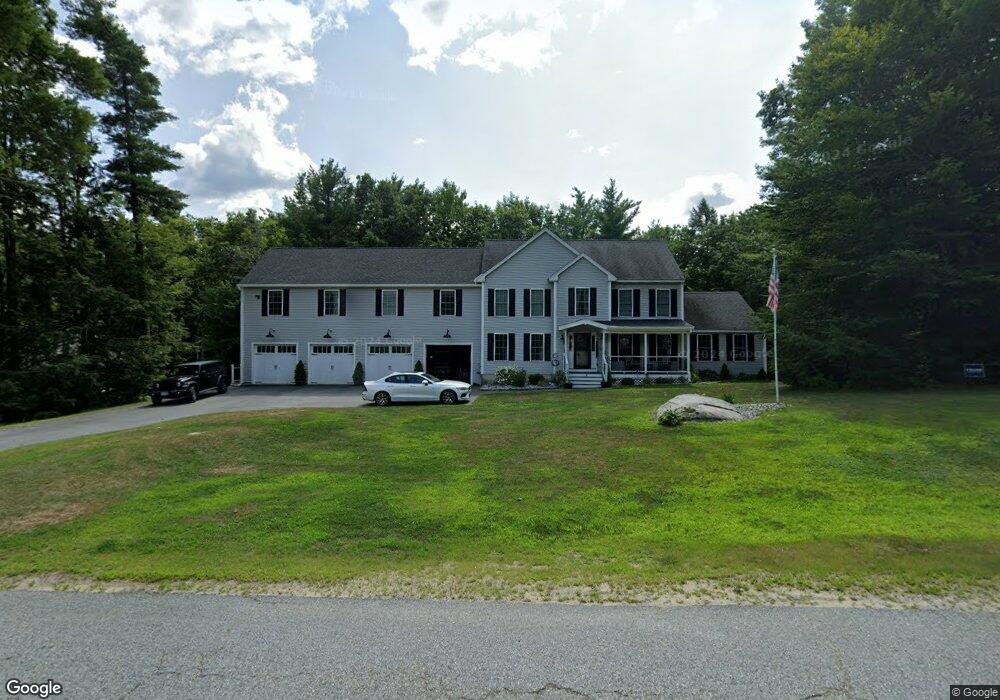
8 Sherry Ln Raymond, NH 03077
Estimated Value: $681,000 - $879,000
4
Beds
5
Baths
3,750
Sq Ft
$206/Sq Ft
Est. Value
About This Home
This home is located at 8 Sherry Ln, Raymond, NH 03077 and is currently estimated at $773,159, approximately $206 per square foot. 8 Sherry Ln is a home located in Rockingham County with nearby schools including Lamprey River Elementary School, Iber Holmes Gove Middle School, and Raymond High School.
Ownership History
Date
Name
Owned For
Owner Type
Purchase Details
Closed on
Jun 24, 2020
Sold by
Dejoy Michael A and Tharpe Heidi
Bought by
Tharpe Heidi and Tharpe Steven
Current Estimated Value
Home Financials for this Owner
Home Financials are based on the most recent Mortgage that was taken out on this home.
Original Mortgage
$333,000
Outstanding Balance
$293,300
Interest Rate
3.1%
Mortgage Type
New Conventional
Estimated Equity
$479,859
Purchase Details
Closed on
Jun 12, 2018
Sold by
Wirtz Peter A
Bought by
Dejoy Michael A and Tharpe Heidi
Purchase Details
Closed on
Jul 30, 2004
Sold by
Rockwood Construction
Bought by
Wirtz Peter A
Home Financials for this Owner
Home Financials are based on the most recent Mortgage that was taken out on this home.
Original Mortgage
$129,000
Interest Rate
6.33%
Mortgage Type
Purchase Money Mortgage
Create a Home Valuation Report for This Property
The Home Valuation Report is an in-depth analysis detailing your home's value as well as a comparison with similar homes in the area
Home Values in the Area
Average Home Value in this Area
Purchase History
| Date | Buyer | Sale Price | Title Company |
|---|---|---|---|
| Tharpe Heidi | -- | None Available | |
| Tharpe Heidi | -- | None Available | |
| Dejoy Michael A | $344,000 | -- | |
| Dejoy Michael A | $344,000 | -- | |
| Wirtz Peter A | $324,900 | -- |
Source: Public Records
Mortgage History
| Date | Status | Borrower | Loan Amount |
|---|---|---|---|
| Open | Tharpe Heidi | $333,000 | |
| Closed | Tharpe Heidi | $333,000 | |
| Previous Owner | Wirtz Peter A | $20,000 | |
| Previous Owner | Wirtz Peter A | $188,000 | |
| Previous Owner | Wirtz Peter A | $40,000 | |
| Previous Owner | Wirtz Peter A | $129,000 |
Source: Public Records
Tax History Compared to Growth
Tax History
| Year | Tax Paid | Tax Assessment Tax Assessment Total Assessment is a certain percentage of the fair market value that is determined by local assessors to be the total taxable value of land and additions on the property. | Land | Improvement |
|---|---|---|---|---|
| 2024 | $13,012 | $593,900 | $117,900 | $476,000 |
| 2023 | $12,306 | $593,900 | $117,900 | $476,000 |
| 2022 | $10,824 | $591,800 | $117,900 | $473,900 |
| 2021 | $10,795 | $583,200 | $117,900 | $465,300 |
| 2020 | $11,101 | $423,700 | $84,400 | $339,300 |
| 2019 | $4,751 | $312,900 | $84,400 | $228,500 |
| 2018 | $7,643 | $312,900 | $84,400 | $228,500 |
| 2017 | $4,681 | $312,900 | $84,400 | $228,500 |
| 2016 | $7,428 | $312,900 | $84,400 | $228,500 |
| 2015 | $7,228 | $288,200 | $84,400 | $203,800 |
| 2014 | $6,822 | $280,400 | $84,400 | $196,000 |
| 2013 | $6,629 | $280,400 | $84,400 | $196,000 |
Source: Public Records
Map
Nearby Homes
- 215 New Hampshire 27
- 69 Long Hill Rd
- 59 Barberry Ln
- 404 Critchett Rd
- 47 Long Hill Rd
- 50 Blackstone Dr
- 199 Raymond Rd
- 297 Crowley Rd
- 23 Main St Unit 3
- 9 Abbey Rd
- M 406 L 75-1 Deerfield Rd
- 209 New Hampshire 27
- 00 Main St
- 0 Lane Rd Unit 39
- 7 Blaisdell Ct
- 6 Blaisdell Ct
- 17 Blaisdell
- 0 Eastside Dr Unit 33
- 236 Main St
- 29 Blaisdell's Trail