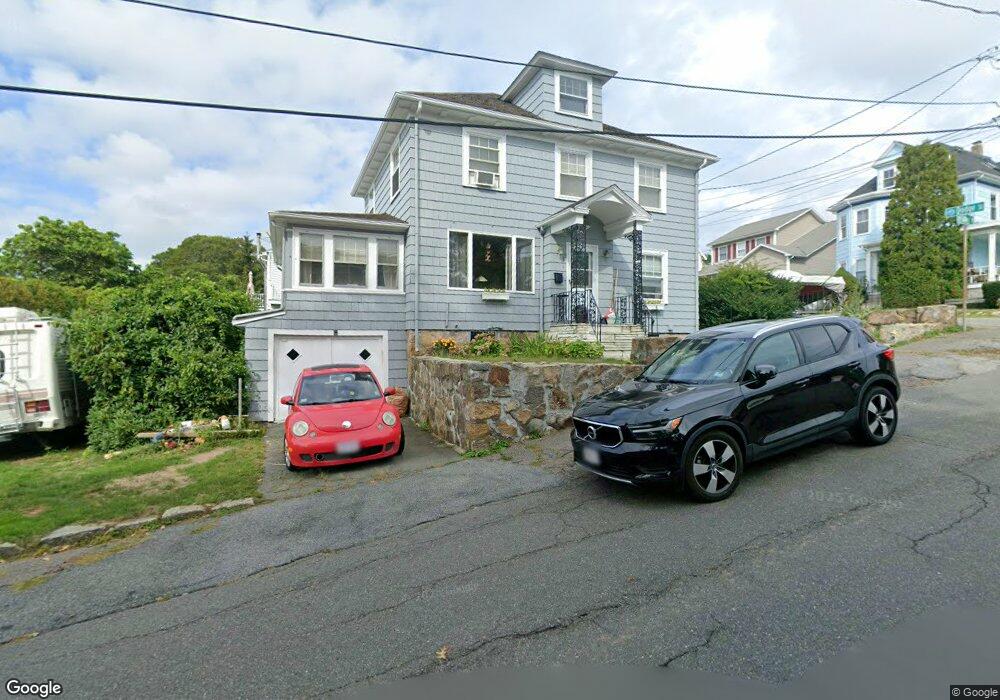
8 Sibley St Gloucester, MA 01930
Central Gloucester NeighborhoodEstimated Value: $441,000 - $570,195
3
Beds
2
Baths
1,200
Sq Ft
$443/Sq Ft
Est. Value
About This Home
This home is located at 8 Sibley St, Gloucester, MA 01930 and is currently estimated at $531,799, approximately $443 per square foot. 8 Sibley St is a home located in Essex County with nearby schools including East Veterans Memorial Elementary, Ralph B O'maley Middle School, and Gloucester High School.
Ownership History
Date
Name
Owned For
Owner Type
Purchase Details
Closed on
Dec 1, 1998
Sold by
Bagaco Carlos M and Bagaco Maria B
Bought by
Latham Dennis E and Latham Patricia
Current Estimated Value
Purchase Details
Closed on
Apr 1, 1996
Sold by
Macneil Peter and Macneil Mary
Bought by
Bagaco Carlos and Bagaco Maria
Create a Home Valuation Report for This Property
The Home Valuation Report is an in-depth analysis detailing your home's value as well as a comparison with similar homes in the area
Home Values in the Area
Average Home Value in this Area
Purchase History
| Date | Buyer | Sale Price | Title Company |
|---|---|---|---|
| Latham Dennis E | $159,900 | -- | |
| Bagaco Carlos | $143,500 | -- |
Source: Public Records
Mortgage History
| Date | Status | Borrower | Loan Amount |
|---|---|---|---|
| Open | Bagaco Carlos | $255,000 | |
| Closed | Bagaco Carlos | $213,500 | |
| Closed | Bagaco Carlos | $186,000 |
Source: Public Records
Tax History
| Year | Tax Paid | Tax Assessment Tax Assessment Total Assessment is a certain percentage of the fair market value that is determined by local assessors to be the total taxable value of land and additions on the property. | Land | Improvement |
|---|---|---|---|---|
| 2025 | $4,579 | $471,100 | $144,500 | $326,600 |
| 2024 | $4,517 | $464,200 | $137,600 | $326,600 |
| 2023 | $4,326 | $408,500 | $122,800 | $285,700 |
| 2022 | $4,192 | $357,400 | $106,800 | $250,600 |
| 2021 | $4,049 | $325,500 | $97,100 | $228,400 |
| 2020 | $3,951 | $320,400 | $97,100 | $223,300 |
| 2019 | $3,738 | $294,600 | $97,100 | $197,500 |
| 2018 | $3,564 | $275,600 | $97,100 | $178,500 |
| 2017 | $3,390 | $257,000 | $87,500 | $169,500 |
| 2016 | $3,231 | $237,400 | $87,500 | $149,900 |
| 2015 | $3,213 | $235,400 | $87,500 | $147,900 |
Source: Public Records
Map
Nearby Homes
- 19 Trask St Unit 2
- 50 Warner St
- 40 Sargent St
- 113 Pleasant St
- 12 Arthur St
- 9 Cleveland Place
- 139A Prospect St
- 33 Maplewood Ave Unit 310
- 98 Maplewood Ave
- 13 Mystic Ave
- 8 Mystic Ave
- 36 Eastern Ave
- 191 Main St Unit 3
- 191 Main St Unit 2A
- 120 Washington St
- 6 Monroe Ct
- 35 Middle St Unit 4
- 33 Middle St
- 20 Beacon St
- 20 Beacon St Unit 2
Your Personal Tour Guide
Ask me questions while you tour the home.