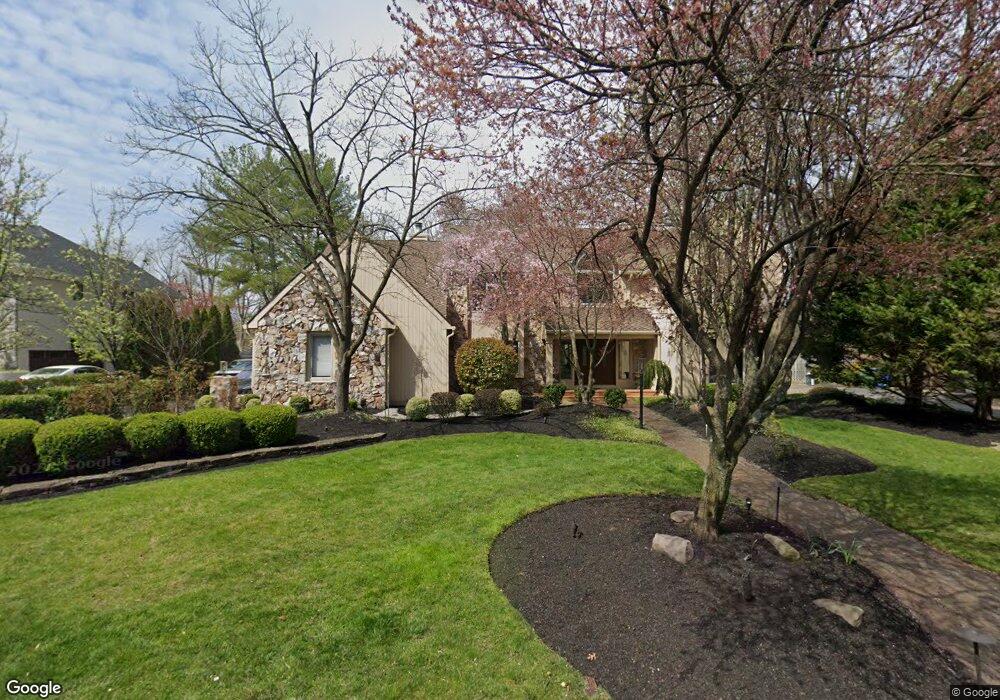
8 Southwood Dr Cherry Hill, NJ 08003
Estimated Value: $1,033,136 - $1,067,000
--
Bed
--
Bath
4,339
Sq Ft
$242/Sq Ft
Est. Value
About This Home
This home is located at 8 Southwood Dr, Cherry Hill, NJ 08003 and is currently estimated at $1,048,712, approximately $241 per square foot. 8 Southwood Dr is a home located in Camden County with nearby schools including James H. Johnson School, Henry C. Beck Middle School, and Cherry Hill High-East High School.
Ownership History
Date
Name
Owned For
Owner Type
Purchase Details
Closed on
Nov 25, 2020
Sold by
Orenstein Jonathan H and Orenstein Lisa
Bought by
Schwartz Andrew and Schwartz Gloria
Current Estimated Value
Home Financials for this Owner
Home Financials are based on the most recent Mortgage that was taken out on this home.
Original Mortgage
$510,400
Outstanding Balance
$454,408
Interest Rate
2.7%
Mortgage Type
New Conventional
Estimated Equity
$594,304
Purchase Details
Closed on
Jun 2, 2006
Sold by
Thurm Arthur
Bought by
Orenstein Jonathan H and Orenstein Lisa
Home Financials for this Owner
Home Financials are based on the most recent Mortgage that was taken out on this home.
Original Mortgage
$417,000
Interest Rate
6.62%
Create a Home Valuation Report for This Property
The Home Valuation Report is an in-depth analysis detailing your home's value as well as a comparison with similar homes in the area
Home Values in the Area
Average Home Value in this Area
Purchase History
| Date | Buyer | Sale Price | Title Company |
|---|---|---|---|
| Schwartz Andrew | $745,000 | Chicago Title Insurance Co | |
| Schwartz Andrew | $745,000 | Chicago Title | |
| Orenstein Jonathan H | $835,000 | -- |
Source: Public Records
Mortgage History
| Date | Status | Borrower | Loan Amount |
|---|---|---|---|
| Open | Schwartz Andrew | $510,400 | |
| Closed | Schwartz Andrew | $510,400 | |
| Previous Owner | Orenstein Jonathan H | $417,000 |
Source: Public Records
Tax History Compared to Growth
Tax History
| Year | Tax Paid | Tax Assessment Tax Assessment Total Assessment is a certain percentage of the fair market value that is determined by local assessors to be the total taxable value of land and additions on the property. | Land | Improvement |
|---|---|---|---|---|
| 2025 | $25,042 | $561,600 | $152,500 | $409,100 |
| 2024 | $23,598 | $561,600 | $152,500 | $409,100 |
| 2023 | $23,598 | $561,600 | $152,500 | $409,100 |
| 2022 | $22,947 | $561,600 | $152,500 | $409,100 |
| 2021 | $23,020 | $561,600 | $152,500 | $409,100 |
| 2020 | $22,739 | $561,600 | $152,500 | $409,100 |
| 2019 | $22,728 | $561,600 | $152,500 | $409,100 |
| 2018 | $22,666 | $561,600 | $152,500 | $409,100 |
| 2017 | $21,362 | $561,600 | $152,500 | $409,100 |
| 2016 | $21,078 | $561,600 | $152,500 | $409,100 |
| 2015 | $20,745 | $561,600 | $152,500 | $409,100 |
| 2014 | $20,514 | $561,600 | $152,500 | $409,100 |
Source: Public Records
Map
Nearby Homes
- 4 Southwood Dr
- 16 Doncaster Rd
- 1004 Owl Place
- 4 Fairhaven Ct
- 1912 Cardinal Lake Dr
- 22 Country Walk
- 1869 W Point Dr
- 1314 Kresson Rd
- 32 Country Walk
- 1105 Heartwood Dr
- 533 Heartwood Rd
- 1321 Chanticleer
- 1248 Chanticleer
- 1132 Chanticleer
- 1759 Tearose Ln
- 822 Chanticleer
- 503 Balsam Rd
- 1217 Liberty Bell Dr
- 34 Lafayette Ln
- 422 Chanticleer
- 6 Southwood Dr
- 10 Southwood Dr
- 12 Southwood Dr
- 58 Southwood Dr
- 2 Southwood Dr
- 14 Southwood Dr
- 11 Southwood Dr
- 1095 Springdale Rd
- 9 Southwood Dr
- 15 Southwood Dr
- 1097 Springdale Rd
- 56 Southwood Dr
- 16 Southwood Dr
- 7 Southwood Dr
- 17 Southwood Dr
- 5 Southwood Dr
- 1087 Springdale Rd
- 1 Southwood Dr
- 18 Southwood Dr
- 54 Southwood Dr