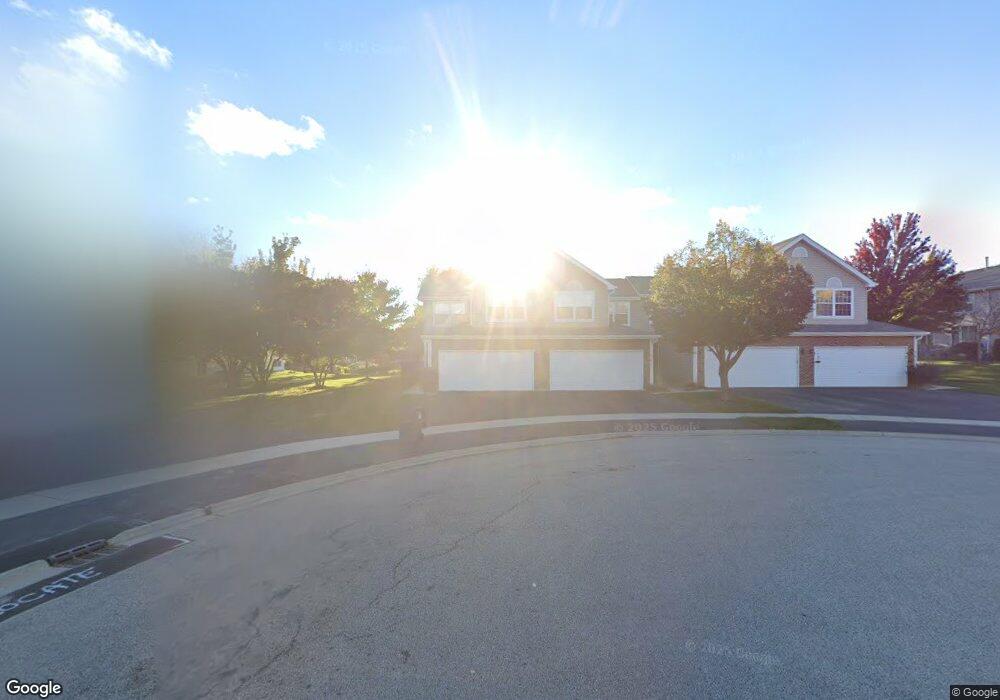
8 Steven Ct Algonquin, IL 60102
Estimated Value: $274,844 - $293,000
2
Beds
3
Baths
1,398
Sq Ft
$202/Sq Ft
Est. Value
About This Home
This home is located at 8 Steven Ct, Algonquin, IL 60102 and is currently estimated at $281,711, approximately $201 per square foot. 8 Steven Ct is a home located in McHenry County with nearby schools including Westfield Community School, Kenneth E Neubert Elementary School, and Harry D Jacobs High School.
Ownership History
Date
Name
Owned For
Owner Type
Purchase Details
Closed on
Mar 29, 2001
Sold by
Zhang Jing B
Bought by
Shields Jeremiah P and Steiger Holly A
Current Estimated Value
Home Financials for this Owner
Home Financials are based on the most recent Mortgage that was taken out on this home.
Original Mortgage
$109,500
Outstanding Balance
$40,456
Interest Rate
7.05%
Estimated Equity
$241,255
Purchase Details
Closed on
Feb 28, 1997
Sold by
Wayne Lisa M
Bought by
Zhang Jing B
Home Financials for this Owner
Home Financials are based on the most recent Mortgage that was taken out on this home.
Original Mortgage
$109,250
Interest Rate
7.37%
Purchase Details
Closed on
Aug 16, 1994
Sold by
Maywood Proviso State Bank
Bought by
Wayne Lisa M
Home Financials for this Owner
Home Financials are based on the most recent Mortgage that was taken out on this home.
Original Mortgage
$110,850
Interest Rate
7.5%
Create a Home Valuation Report for This Property
The Home Valuation Report is an in-depth analysis detailing your home's value as well as a comparison with similar homes in the area
Purchase History
| Date | Buyer | Sale Price | Title Company |
|---|---|---|---|
| Shields Jeremiah P | $136,900 | Attorneys Title Guaranty Fun | |
| Zhang Jing B | $115,000 | -- | |
| Wayne Lisa M | $116,666 | -- |
Source: Public Records
Mortgage History
| Date | Status | Borrower | Loan Amount |
|---|---|---|---|
| Open | Shields Jeremiah P | $109,500 | |
| Previous Owner | Zhang Jing B | $109,250 | |
| Previous Owner | Wayne Lisa M | $110,850 |
Source: Public Records
Tax History
| Year | Tax Paid | Tax Assessment Tax Assessment Total Assessment is a certain percentage of the fair market value that is determined by local assessors to be the total taxable value of land and additions on the property. | Land | Improvement |
|---|---|---|---|---|
| 2024 | $5,096 | $73,139 | $13,825 | $59,314 |
| 2023 | $4,806 | $65,414 | $12,365 | $53,049 |
| 2022 | $4,243 | $55,481 | $11,160 | $44,321 |
| 2021 | $4,054 | $51,687 | $10,397 | $41,290 |
| 2020 | $3,938 | $49,857 | $10,029 | $39,828 |
| 2019 | $3,831 | $47,719 | $9,599 | $38,120 |
| 2018 | $3,465 | $42,352 | $8,867 | $33,485 |
| 2017 | $3,376 | $39,898 | $8,353 | $31,545 |
| 2016 | $3,304 | $37,420 | $7,834 | $29,586 |
| 2013 | -- | $44,795 | $7,308 | $37,487 |
Source: Public Records
Map
Nearby Homes
- 1431 Essex St
- 13 Brian Ct
- 909 Roger St
- LOT 3 Blackhawk Dr
- 135 Arquilla Dr
- 298 Apache Trail
- 338 Hiawatha Dr
- 7 Falcon Ridge Ct
- 700 Fairfield Ln
- 145 S Oakleaf Rd
- 1920 Jester Ln
- 935 Viewpoint Dr
- 730 Chestnut Ct
- 900 Windstone Ct
- 966 Mesa Dr
- 521 Pawnee Dr
- 939 Mesa Dr
- 1096 Viewpoint Dr
- 113 Pheasant Trail
- 1820 Crofton Dr
Your Personal Tour Guide
Ask me questions while you tour the home.