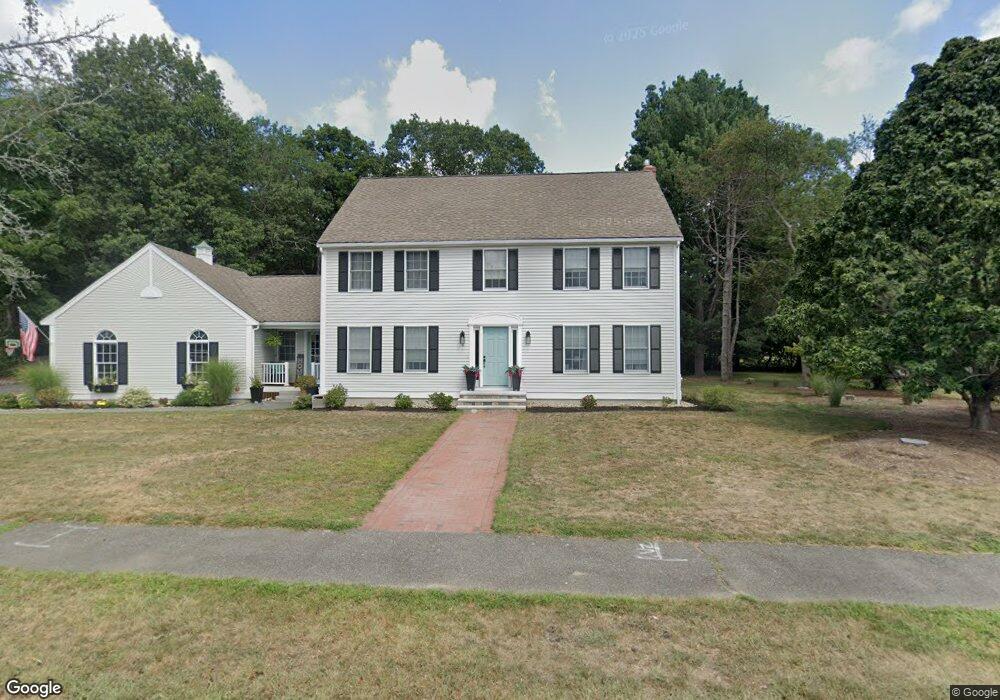
8 Surrey Ln Danvers, MA 01923
Estimated Value: $1,026,112 - $1,103,000
3
Beds
4
Baths
2,578
Sq Ft
$409/Sq Ft
Est. Value
About This Home
This home is located at 8 Surrey Ln, Danvers, MA 01923 and is currently estimated at $1,055,278, approximately $409 per square foot. 8 Surrey Ln is a home located in Essex County with nearby schools including Danvers High School, St. Mary of the Annunciation School, and St. John's Prep.
Ownership History
Date
Name
Owned For
Owner Type
Purchase Details
Closed on
Jun 30, 2023
Sold by
Walfield Matthew W and Walfield Steven J
Bought by
Lockhart Danielle and Lockhart Jameson
Current Estimated Value
Home Financials for this Owner
Home Financials are based on the most recent Mortgage that was taken out on this home.
Original Mortgage
$425,000
Outstanding Balance
$414,086
Interest Rate
6.39%
Mortgage Type
Purchase Money Mortgage
Estimated Equity
$641,192
Purchase Details
Closed on
Oct 7, 2016
Sold by
Walfield Wilbert H
Bought by
Walfield Steven J and Walfield Matthew W
Purchase Details
Closed on
Aug 10, 2015
Sold by
Walfield Wilbert H and Walfield Anne M
Bought by
Walfield Sr Ft and Walfield
Purchase Details
Closed on
Nov 5, 2012
Sold by
Walfield Anne M
Bought by
Walfield Wilbert H and Walfield Anne M
Create a Home Valuation Report for This Property
The Home Valuation Report is an in-depth analysis detailing your home's value as well as a comparison with similar homes in the area
Home Values in the Area
Average Home Value in this Area
Purchase History
| Date | Buyer | Sale Price | Title Company |
|---|---|---|---|
| Lockhart Danielle | $1,000,000 | None Available | |
| Walfield Steven J | -- | -- | |
| Walfield Wilbert H | -- | -- | |
| Walfield Sr Ft | -- | -- | |
| Walfield Wilbert H | -- | -- | |
| Walfield Wilbert H | -- | -- |
Source: Public Records
Mortgage History
| Date | Status | Borrower | Loan Amount |
|---|---|---|---|
| Open | Lockhart Danielle | $425,000 | |
| Previous Owner | Walfield Wilbert H | $62,000 | |
| Previous Owner | Walfield Wilbert H | $90,000 | |
| Previous Owner | Walfield Wilbert H | $110,000 |
Source: Public Records
Tax History
| Year | Tax Paid | Tax Assessment Tax Assessment Total Assessment is a certain percentage of the fair market value that is determined by local assessors to be the total taxable value of land and additions on the property. | Land | Improvement |
|---|---|---|---|---|
| 2025 | $10,020 | $911,700 | $445,600 | $466,100 |
| 2024 | $9,633 | $867,100 | $418,600 | $448,500 |
| 2023 | $9,194 | $782,500 | $378,100 | $404,400 |
| 2022 | $8,857 | $699,600 | $324,100 | $375,500 |
| 2021 | $8,547 | $640,200 | $310,600 | $329,600 |
| 2020 | $8,650 | $662,300 | $295,800 | $366,500 |
| 2019 | $8,131 | $612,300 | $256,600 | $355,700 |
| 2018 | $7,967 | $588,400 | $256,600 | $331,800 |
| 2017 | $8,034 | $566,200 | $256,600 | $309,600 |
| 2016 | $7,922 | $557,900 | $256,600 | $301,300 |
| 2015 | $7,774 | $521,400 | $236,300 | $285,100 |
Source: Public Records
Map
Nearby Homes
- 12 Exeter St
- 6 Colby Rd
- 55 Burley St
- 35 Locust St Unit 3
- 4 Butler Ave
- 4 Chatham Ln
- 22 Maple Ave
- 6 Venice St Unit B3
- 78 North St
- 35 High St Unit 3D
- 11 Spring St
- 14 Williams St Unit C17
- 7 Riverbank Ave Unit 7
- 7 Riverbank Ave
- 11 Riverside Ave Unit 111
- 35 Bayview Terrace Unit 7
- 34 Bayview Terrace Unit 5
- 10 Clark St
- 2 Iroquois Rd
- 6 Laurine Rd
Your Personal Tour Guide
Ask me questions while you tour the home.