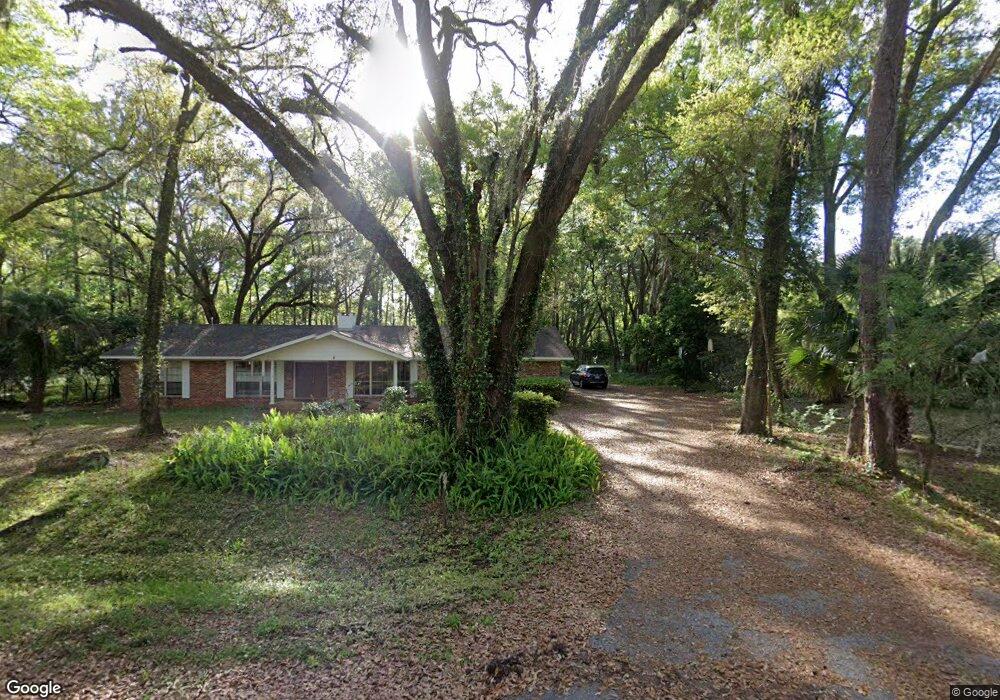
8 SW 79th Dr Gainesville, FL 32607
Estimated Value: $410,000 - $499,000
4
Beds
2
Baths
2,855
Sq Ft
$154/Sq Ft
Est. Value
About This Home
This home is located at 8 SW 79th Dr, Gainesville, FL 32607 and is currently estimated at $440,343, approximately $154 per square foot. 8 SW 79th Dr is a home located in Alachua County with nearby schools including Myra Terwilliger Elementary School, Kanapaha Middle School, and F.W. Buchholz High School.
Ownership History
Date
Name
Owned For
Owner Type
Purchase Details
Closed on
Nov 17, 2022
Sold by
Campbell David E and Campbell Olga L
Bought by
Ferrer Omar Emilio and Ferrer Jessica Ann
Current Estimated Value
Home Financials for this Owner
Home Financials are based on the most recent Mortgage that was taken out on this home.
Original Mortgage
$268,710
Outstanding Balance
$259,818
Interest Rate
6.94%
Mortgage Type
VA
Estimated Equity
$180,525
Purchase Details
Closed on
Aug 1, 2002
Sold by
Herbert John Robert and Herbert Barbara Jean H
Bought by
Campbell David E and Infante Olga L
Home Financials for this Owner
Home Financials are based on the most recent Mortgage that was taken out on this home.
Original Mortgage
$153,000
Interest Rate
6.62%
Purchase Details
Closed on
Dec 1, 1987
Bought by
Infante Campbell and Infante
Purchase Details
Closed on
Aug 1, 1986
Bought by
Infante Campbell and Infante
Purchase Details
Closed on
Feb 1, 1983
Bought by
Infante Campbell and Infante
Create a Home Valuation Report for This Property
The Home Valuation Report is an in-depth analysis detailing your home's value as well as a comparison with similar homes in the area
Purchase History
| Date | Buyer | Sale Price | Title Company |
|---|---|---|---|
| Ferrer Omar Emilio | $350,000 | Haile Title | |
| Campbell David E | $173,700 | -- | |
| Infante Campbell | $120,000 | -- | |
| Infante Campbell | $110,000 | -- | |
| Infante Campbell | $95,600 | -- |
Source: Public Records
Mortgage History
| Date | Status | Borrower | Loan Amount |
|---|---|---|---|
| Open | Ferrer Omar Emilio | $268,710 | |
| Previous Owner | Campbell David E | $153,000 |
Source: Public Records
Tax History
| Year | Tax Paid | Tax Assessment Tax Assessment Total Assessment is a certain percentage of the fair market value that is determined by local assessors to be the total taxable value of land and additions on the property. | Land | Improvement |
|---|---|---|---|---|
| 2025 | $5,995 | $313,550 | -- | -- |
| 2024 | $5,726 | $304,713 | -- | -- |
| 2023 | $5,726 | $295,838 | $70,000 | $225,838 |
| 2022 | $6,369 | $290,903 | $60,000 | $230,903 |
| 2021 | $5,873 | $256,426 | $68,000 | $188,426 |
| 2020 | $5,947 | $259,366 | $68,000 | $191,366 |
| 2019 | $5,779 | $245,949 | $68,000 | $177,949 |
| 2018 | $5,565 | $246,800 | $68,000 | $178,800 |
| 2017 | $5,442 | $249,400 | $68,000 | $181,400 |
| 2016 | $4,772 | $195,000 | $0 | $0 |
| 2015 | $4,843 | $192,500 | $0 | $0 |
| 2014 | $4,330 | $175,000 | $0 | $0 |
| 2013 | -- | $176,800 | $48,000 | $128,800 |
Source: Public Records
Map
Nearby Homes
- 425 NW 79th Dr
- 501 SW 75th Terrace Unit H-6
- 8604 NW 1st Ave
- 8424 NW 4th Place
- 501 SW 75th St Unit A11
- 501 SW 75th St Unit C4
- 501 SW 75th St Unit F3
- 501 SW 75th St Unit G3
- 501 SW 75th St Unit H6
- 501 SW 75th St Unit F11
- 611 SW 75th St Unit 104
- 804 SW 80th Way
- 605 SW 75th St Unit 103
- 7713 SW 8th Ave
- 703 SW 75th St Unit 106
- 711 SW 75th St Unit 106
- 717 SW 75th St Unit 103
- 707 SW 75th St Unit 109
- 719 SW 75th St Unit 103
- 8802 NW 6th Place
- 8 SW 79th Dr
- 20 SW 79th Dr
- 100 SW 79th Dr
- 8019 NW 1st Place
- 15 SW 79th Dr
- 11 NW 79th Dr
- 25 SW 79th Dr
- 21 NW 79th Dr
- 110 NW 79th Dr
- 8103 NW 1st Place
- 500 S 13th St Unit M-13
- 125 SW 80th Dr
- 139 SW 80th Dr
- 7901 SW 1st Place
- 111 NW 79th Dr
- 111 NW 79th Dr
- 7817 SW 1st Place
- 8117 NW 1st Place
- 7911 SW 1st Place
- 8108 NW 1st Place
Your Personal Tour Guide
Ask me questions while you tour the home.