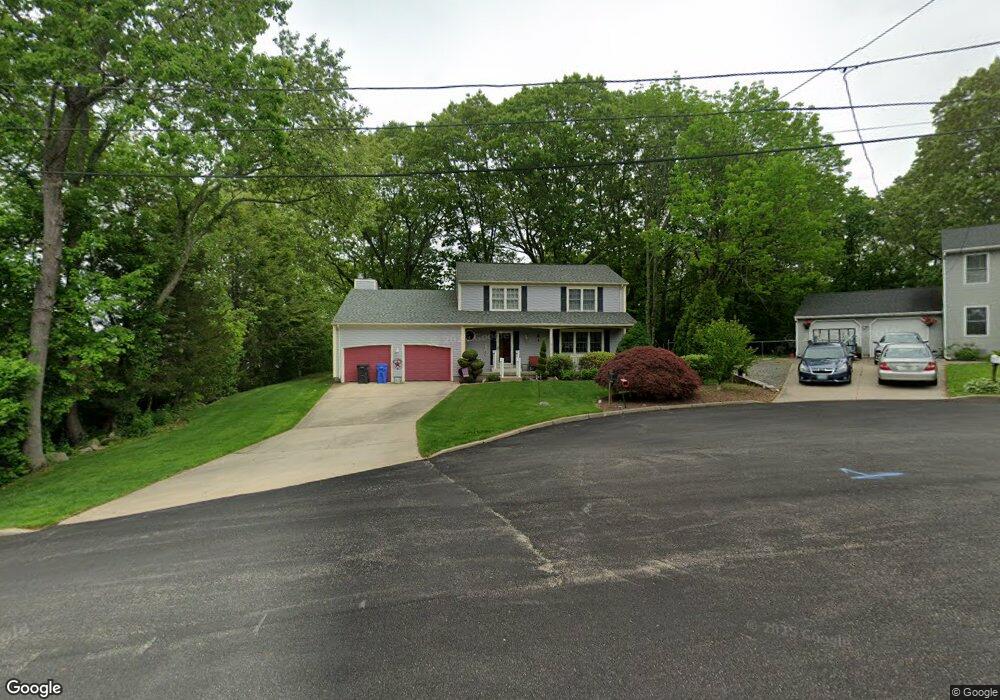
8 Terra Ct Cranston, RI 02920
Thornton NeighborhoodEstimated Value: $575,000 - $741,000
3
Beds
3
Baths
2,196
Sq Ft
$289/Sq Ft
Est. Value
About This Home
This home is located at 8 Terra Ct, Cranston, RI 02920 and is currently estimated at $634,258, approximately $288 per square foot. 8 Terra Ct is a home located in Providence County with nearby schools including Stone Hill School, Western Hills Middle School, and Cranston High School West.
Ownership History
Date
Name
Owned For
Owner Type
Purchase Details
Closed on
Jan 27, 2014
Sold by
Dimascolo Hugo G and Dimascolo Sharon A
Bought by
Sharon A Dimascolo T
Current Estimated Value
Purchase Details
Closed on
Oct 11, 1990
Sold by
Plante Richard W
Bought by
Dimascolo Hugo G
Create a Home Valuation Report for This Property
The Home Valuation Report is an in-depth analysis detailing your home's value as well as a comparison with similar homes in the area
Home Values in the Area
Average Home Value in this Area
Purchase History
| Date | Buyer | Sale Price | Title Company |
|---|---|---|---|
| Sharon A Dimascolo T | -- | -- | |
| Dimascolo Hugo G | $235,000 | -- |
Source: Public Records
Mortgage History
| Date | Status | Borrower | Loan Amount |
|---|---|---|---|
| Open | Dimascolo Hugo G | $100,000 | |
| Previous Owner | Dimascolo Hugo G | $127,000 | |
| Previous Owner | Dimascolo Hugo G | $90,000 |
Source: Public Records
Tax History Compared to Growth
Tax History
| Year | Tax Paid | Tax Assessment Tax Assessment Total Assessment is a certain percentage of the fair market value that is determined by local assessors to be the total taxable value of land and additions on the property. | Land | Improvement |
|---|---|---|---|---|
| 2025 | $7,304 | $526,200 | $162,400 | $363,800 |
| 2024 | $7,162 | $526,200 | $162,400 | $363,800 |
| 2023 | $7,248 | $383,500 | $116,100 | $267,400 |
| 2022 | $7,099 | $383,500 | $116,100 | $267,400 |
| 2021 | $6,903 | $383,500 | $116,100 | $267,400 |
| 2020 | $7,043 | $339,100 | $116,100 | $223,000 |
| 2019 | $7,043 | $339,100 | $116,100 | $223,000 |
| 2018 | $6,880 | $339,100 | $116,100 | $223,000 |
| 2017 | $7,279 | $317,300 | $99,500 | $217,800 |
| 2016 | $7,123 | $317,300 | $99,500 | $217,800 |
| 2015 | $7,123 | $317,300 | $99,500 | $217,800 |
| 2014 | $6,930 | $303,400 | $95,400 | $208,000 |
Source: Public Records
Map
Nearby Homes