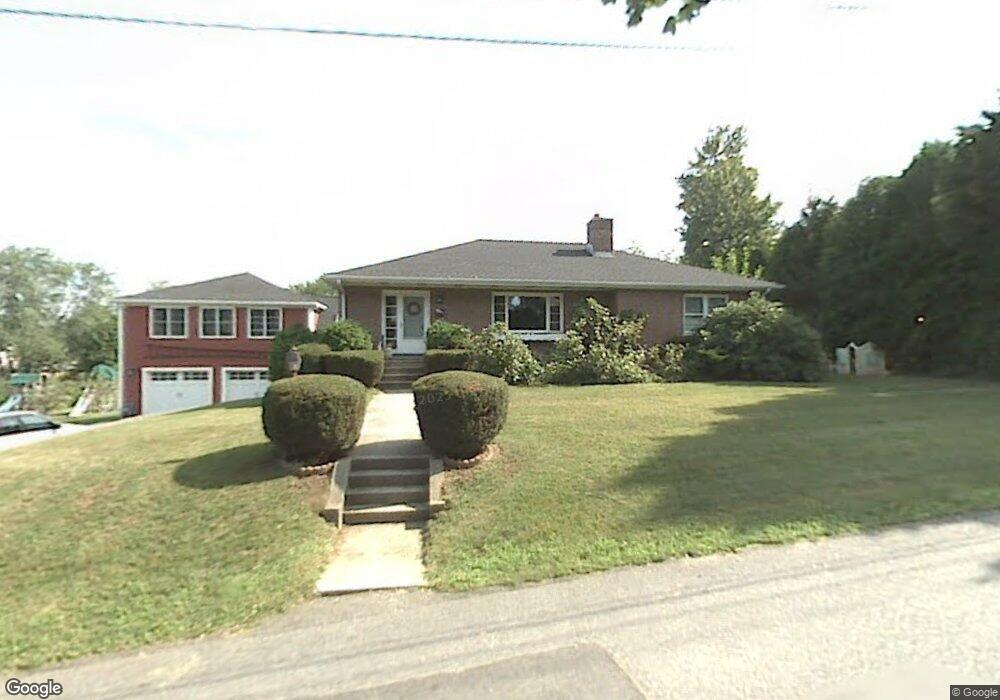
8 Terrence Ave Clinton, MA 01510
Estimated Value: $568,000 - $725,000
3
Beds
2
Baths
3,165
Sq Ft
$199/Sq Ft
Est. Value
About This Home
This home is located at 8 Terrence Ave, Clinton, MA 01510 and is currently estimated at $628,974, approximately $198 per square foot. 8 Terrence Ave is a home located in Worcester County with nearby schools including Clinton Senior High School, Clinton Elementary School, and Clinton Middle School.
Ownership History
Date
Name
Owned For
Owner Type
Purchase Details
Closed on
Sep 15, 2003
Sold by
Dilorenzo Barbara
Bought by
Gavin Patricia W and Gavin Paul S
Current Estimated Value
Home Financials for this Owner
Home Financials are based on the most recent Mortgage that was taken out on this home.
Original Mortgage
$80,000
Outstanding Balance
$37,061
Interest Rate
6.22%
Mortgage Type
Purchase Money Mortgage
Estimated Equity
$591,913
Create a Home Valuation Report for This Property
The Home Valuation Report is an in-depth analysis detailing your home's value as well as a comparison with similar homes in the area
Home Values in the Area
Average Home Value in this Area
Purchase History
| Date | Buyer | Sale Price | Title Company |
|---|---|---|---|
| Gavin Patricia W | $270,000 | -- |
Source: Public Records
Mortgage History
| Date | Status | Borrower | Loan Amount |
|---|---|---|---|
| Open | Gavin Patricia W | $80,000 |
Source: Public Records
Tax History Compared to Growth
Tax History
| Year | Tax Paid | Tax Assessment Tax Assessment Total Assessment is a certain percentage of the fair market value that is determined by local assessors to be the total taxable value of land and additions on the property. | Land | Improvement |
|---|---|---|---|---|
| 2025 | $7,975 | $599,600 | $128,600 | $471,000 |
| 2024 | $8,306 | $632,100 | $128,600 | $503,500 |
| 2023 | $7,779 | $581,800 | $116,800 | $465,000 |
| 2022 | $7,723 | $518,000 | $106,200 | $411,800 |
| 2021 | $3,722 | $470,900 | $101,300 | $369,600 |
| 2020 | $7,294 | $470,900 | $101,300 | $369,600 |
| 2019 | $3,920 | $431,600 | $98,300 | $333,300 |
| 2018 | $3,145 | $377,000 | $98,300 | $278,700 |
| 2017 | $3,056 | $341,200 | $98,300 | $242,900 |
| 2016 | $5,722 | $331,300 | $98,300 | $233,000 |
| 2015 | $5,120 | $307,300 | $98,200 | $209,100 |
| 2014 | $4,963 | $307,300 | $98,200 | $209,100 |
Source: Public Records
Map
Nearby Homes
- 160 Park St
- 284 Main St
- 13 Simon Ct
- 403 Main St
- 286 Grove St
- 286 Grove St Unit 286
- 125 Grove St
- 38 Norman St
- 40 Nashua St Unit 5
- 19 Sprague Rd
- 37 Grove St Unit 37
- 18 Eagle Nest Unit 331
- 70 Oak St Unit 70
- 78 Oak St Unit 78
- 24 Rigby St
- 109 Oak St
- 55 Sterling St Unit 306
- 55 Sterling St Unit 314
- 51 Rigby St
- 89 1/2 Walnut St