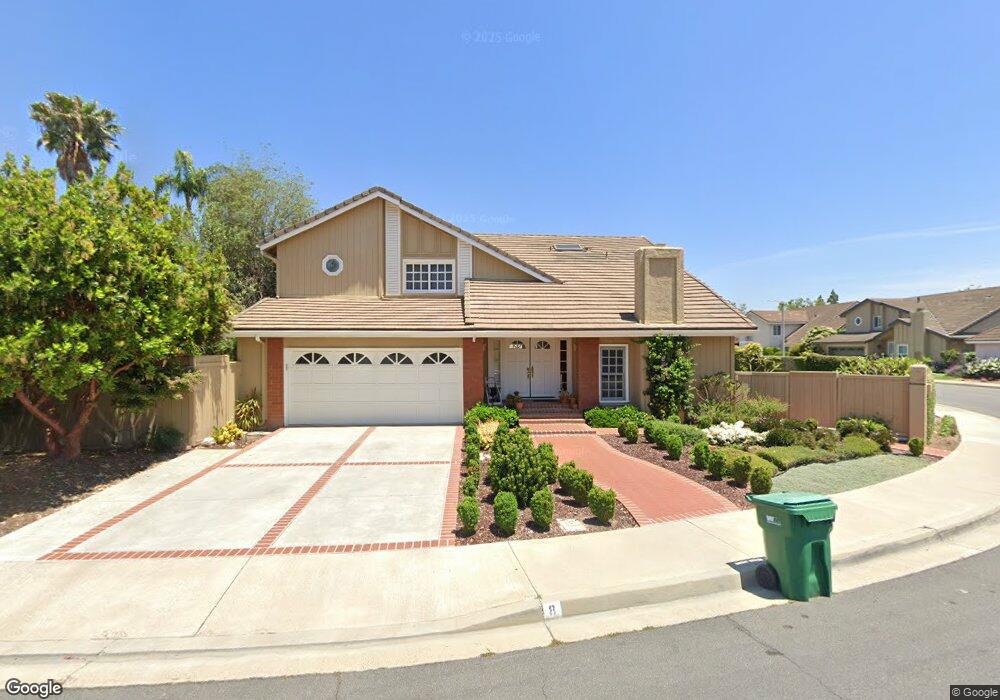
8 Timberline Irvine, CA 92604
Walnut NeighborhoodEstimated Value: $1,862,147 - $1,887,000
4
Beds
3
Baths
2,575
Sq Ft
$726/Sq Ft
Est. Value
About This Home
This home is located at 8 Timberline, Irvine, CA 92604 and is currently estimated at $1,869,537, approximately $726 per square foot. 8 Timberline is a home located in Orange County with nearby schools including Deerfield Elementary School, Venado Middle School, and Irvine High School.
Ownership History
Date
Name
Owned For
Owner Type
Purchase Details
Closed on
Jul 15, 2017
Sold by
Rahmann Steven E and Rahmann Hilda B
Bought by
Rahmann Steven E and Rahmann Hilda B
Current Estimated Value
Purchase Details
Closed on
Jan 24, 2001
Sold by
Rahmann Steven E and Rahmann Hilda B
Bought by
Rahmann Steven E and Rahmann Hilda B
Home Financials for this Owner
Home Financials are based on the most recent Mortgage that was taken out on this home.
Original Mortgage
$339,000
Outstanding Balance
$122,452
Interest Rate
7.08%
Estimated Equity
$1,747,085
Purchase Details
Closed on
Apr 14, 2000
Sold by
Thomas Lynn K
Bought by
Rahmann Steven E and Rahmann Hilda B
Home Financials for this Owner
Home Financials are based on the most recent Mortgage that was taken out on this home.
Original Mortgage
$375,200
Interest Rate
8%
Purchase Details
Closed on
Mar 11, 1994
Sold by
Thomas Lynn K
Bought by
Thomas Lynn Kluge and Lynn Kluge Thomas Trust
Create a Home Valuation Report for This Property
The Home Valuation Report is an in-depth analysis detailing your home's value as well as a comparison with similar homes in the area
Home Values in the Area
Average Home Value in this Area
Purchase History
| Date | Buyer | Sale Price | Title Company |
|---|---|---|---|
| Rahmann Steven E | -- | None Available | |
| Rahmann Steven E | -- | Southland Title Corporation | |
| Rahmann Steven E | $469,000 | Chicago Title Co | |
| Thomas Lynn Kluge | -- | -- |
Source: Public Records
Mortgage History
| Date | Status | Borrower | Loan Amount |
|---|---|---|---|
| Open | Rahmann Steven E | $339,000 | |
| Closed | Rahmann Steven E | $375,200 |
Source: Public Records
Tax History
| Year | Tax Paid | Tax Assessment Tax Assessment Total Assessment is a certain percentage of the fair market value that is determined by local assessors to be the total taxable value of land and additions on the property. | Land | Improvement |
|---|---|---|---|---|
| 2025 | $7,548 | $720,831 | $461,965 | $258,866 |
| 2024 | $7,548 | $706,698 | $452,907 | $253,791 |
| 2023 | $7,353 | $692,842 | $444,027 | $248,815 |
| 2022 | $7,192 | $679,257 | $435,320 | $243,937 |
| 2021 | $7,026 | $665,939 | $426,785 | $239,154 |
| 2020 | $6,986 | $659,111 | $422,409 | $236,702 |
| 2019 | $6,830 | $646,188 | $414,127 | $232,061 |
| 2018 | $6,709 | $633,518 | $406,007 | $227,511 |
| 2017 | $6,569 | $621,097 | $398,047 | $223,050 |
| 2016 | $6,279 | $608,919 | $390,242 | $218,677 |
| 2015 | $6,184 | $599,773 | $384,380 | $215,393 |
| 2014 | $6,064 | $588,025 | $376,851 | $211,174 |
Source: Public Records
Map
Nearby Homes
- 7 Timberline
- 57 Pinewood Unit 29
- 18 Brookdale
- 10 Pinewood
- 12 Silverwood Unit 19
- 7 E Yale Loop
- 16 E Yale Loop
- 5101 Chateau Cir
- 13 Shooting Star
- 4862 Gainsport Cir
- 95 Wildwood Unit 40
- 17 Blazing Star
- 12 Oakdale
- 29 Sandstone
- 32 Goldenbush
- 10 Goldenbush Unit 36
- 11 Park Vista
- 15231 Touraine Way
- 3 Wintergreen Unit 7
- 15335 Seine Cir
Your Personal Tour Guide
Ask me questions while you tour the home.