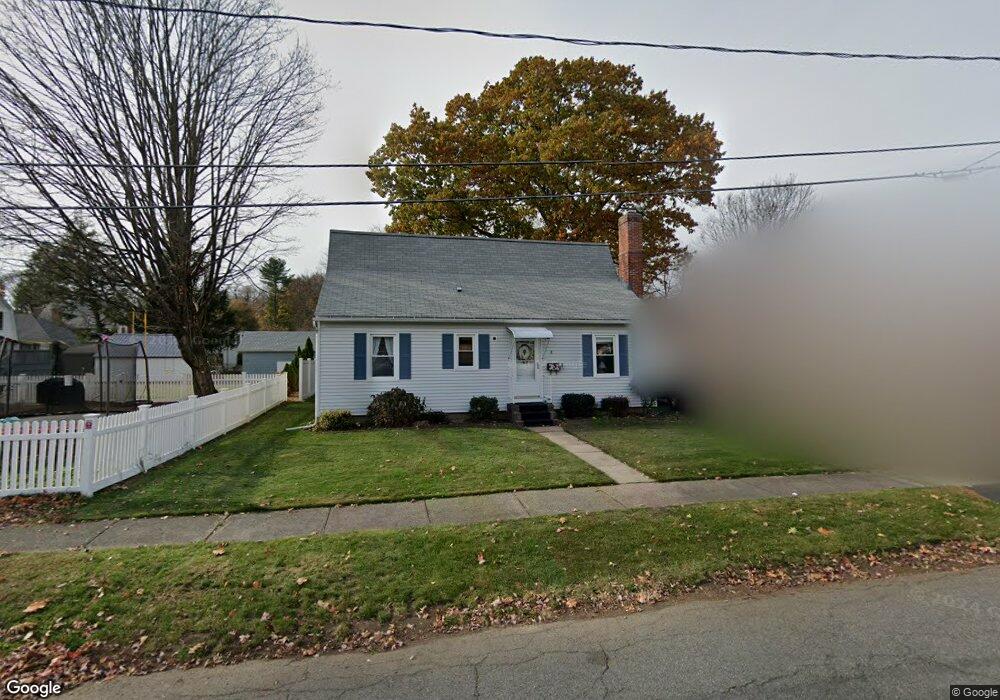
8 Vermont St Greenfield, MA 01301
Estimated Value: $371,000 - $411,000
4
Beds
2
Baths
1,603
Sq Ft
$239/Sq Ft
Est. Value
About This Home
This home is located at 8 Vermont St, Greenfield, MA 01301 and is currently estimated at $382,844, approximately $238 per square foot. 8 Vermont St is a home located in Franklin County with nearby schools including Cornerstone Christian School, Holy Trinity School, and Stoneleigh-Burnham School.
Ownership History
Date
Name
Owned For
Owner Type
Purchase Details
Closed on
Feb 7, 2023
Sold by
Doton Terry E
Bought by
Doton Terry E and Doton Sean P
Current Estimated Value
Purchase Details
Closed on
Aug 31, 1998
Sold by
Kurcharski Donna R and Doton Gerlad R
Bought by
Doton Terry E
Create a Home Valuation Report for This Property
The Home Valuation Report is an in-depth analysis detailing your home's value as well as a comparison with similar homes in the area
Home Values in the Area
Average Home Value in this Area
Purchase History
| Date | Buyer | Sale Price | Title Company |
|---|---|---|---|
| Doton Terry E | -- | None Available | |
| Doton Terry E | -- | None Available | |
| Doton Terry E | $40,000 | -- | |
| Doton Terry E | $40,000 | -- |
Source: Public Records
Mortgage History
| Date | Status | Borrower | Loan Amount |
|---|---|---|---|
| Previous Owner | Doton Terry E | $110,000 | |
| Previous Owner | Doton Terry E | $58,000 | |
| Previous Owner | Doton Terry E | $98,000 |
Source: Public Records
Tax History Compared to Growth
Tax History
| Year | Tax Paid | Tax Assessment Tax Assessment Total Assessment is a certain percentage of the fair market value that is determined by local assessors to be the total taxable value of land and additions on the property. | Land | Improvement |
|---|---|---|---|---|
| 2025 | $5,895 | $301,400 | $82,200 | $219,200 |
| 2024 | $5,936 | $291,100 | $74,700 | $216,400 |
| 2023 | $5,366 | $273,100 | $74,700 | $198,400 |
| 2022 | $5,270 | $236,100 | $71,200 | $164,900 |
| 2021 | $4,932 | $212,400 | $71,900 | $140,500 |
| 2020 | $4,600 | $200,600 | $65,500 | $135,100 |
| 2019 | $4,293 | $192,000 | $56,900 | $135,100 |
| 2018 | $4,230 | $188,600 | $56,200 | $132,400 |
| 2017 | $4,098 | $188,600 | $56,200 | $132,400 |
| 2016 | $4,002 | $183,500 | $55,200 | $128,300 |
| 2015 | $3,998 | $177,600 | $53,400 | $124,200 |
| 2014 | $3,646 | $177,600 | $53,400 | $124,200 |
Source: Public Records
Map
Nearby Homes