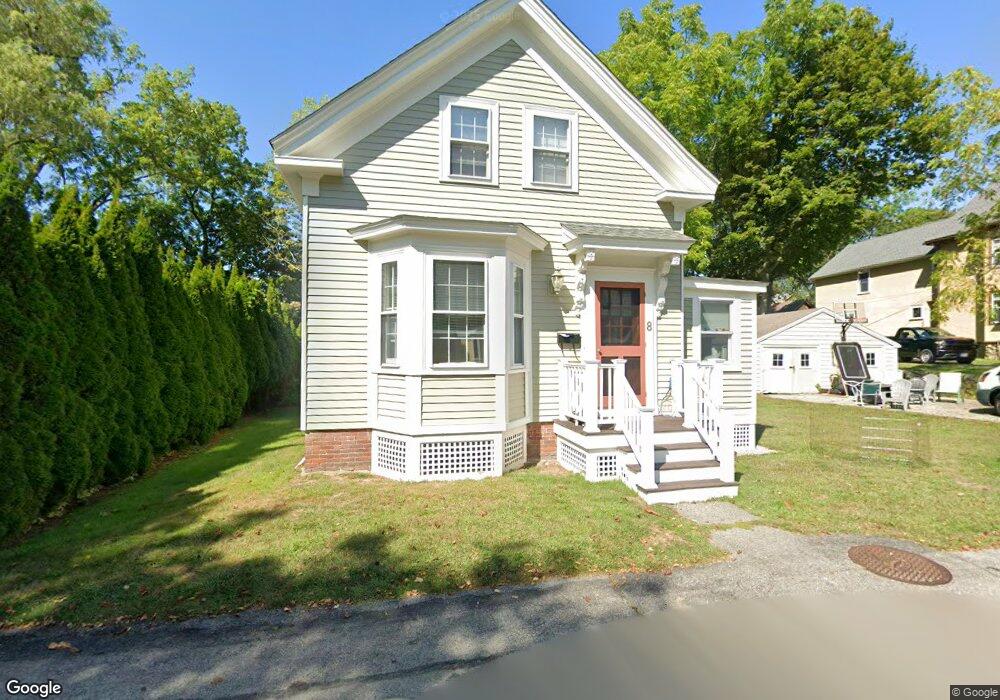
8 Vine St Unit SF Manchester, MA 01944
Estimated Value: $793,249 - $1,032,000
2
Beds
2
Baths
1,400
Sq Ft
$618/Sq Ft
Est. Value
About This Home
This home is located at 8 Vine St Unit SF, Manchester, MA 01944 and is currently estimated at $864,812, approximately $617 per square foot. 8 Vine St Unit SF is a home located in Essex County with nearby schools including Manchester Essex Regional High School, Tara Montessori School, and Glen Urquhart School.
Ownership History
Date
Name
Owned For
Owner Type
Purchase Details
Closed on
Jun 27, 2024
Sold by
Carpenter Jeanne
Bought by
Jeanne T Carpenter Ret and Carpenter
Current Estimated Value
Purchase Details
Closed on
Jul 14, 1992
Sold by
Knowlton George Est
Bought by
8 Vine Street Rt
Home Financials for this Owner
Home Financials are based on the most recent Mortgage that was taken out on this home.
Original Mortgage
$135,000
Interest Rate
8.56%
Mortgage Type
Purchase Money Mortgage
Create a Home Valuation Report for This Property
The Home Valuation Report is an in-depth analysis detailing your home's value as well as a comparison with similar homes in the area
Home Values in the Area
Average Home Value in this Area
Purchase History
| Date | Buyer | Sale Price | Title Company |
|---|---|---|---|
| Jeanne T Carpenter Ret | -- | None Available | |
| Jeanne T Carpenter Ret | -- | None Available | |
| 8 Vine Street Rt | $140,000 | -- | |
| 8 Vine Street Rt | $140,000 | -- |
Source: Public Records
Mortgage History
| Date | Status | Borrower | Loan Amount |
|---|---|---|---|
| Previous Owner | 8 Vine Street Rt | $238,000 | |
| Previous Owner | 8 Vine Street Rt | $234,750 | |
| Previous Owner | 8 Vine Street Rt | $135,000 |
Source: Public Records
Tax History Compared to Growth
Tax History
| Year | Tax Paid | Tax Assessment Tax Assessment Total Assessment is a certain percentage of the fair market value that is determined by local assessors to be the total taxable value of land and additions on the property. | Land | Improvement |
|---|---|---|---|---|
| 2025 | $7,282 | $795,800 | $478,600 | $317,200 |
| 2024 | $7,091 | $758,400 | $461,500 | $296,900 |
| 2023 | $6,947 | $666,100 | $410,200 | $255,900 |
| 2022 | $6,571 | $619,900 | $376,000 | $243,900 |
| 2021 | $6,559 | $596,800 | $358,900 | $237,900 |
| 2020 | $6,612 | $565,100 | $341,800 | $223,300 |
| 2019 | $6,302 | $561,200 | $341,800 | $219,400 |
| 2018 | $6,190 | $561,200 | $341,800 | $219,400 |
| 2017 | $6,173 | $561,200 | $341,800 | $219,400 |
| 2016 | $6,023 | $544,100 | $341,800 | $202,300 |
| 2015 | $5,868 | $541,300 | $307,700 | $233,600 |
Source: Public Records
Map
Nearby Homes