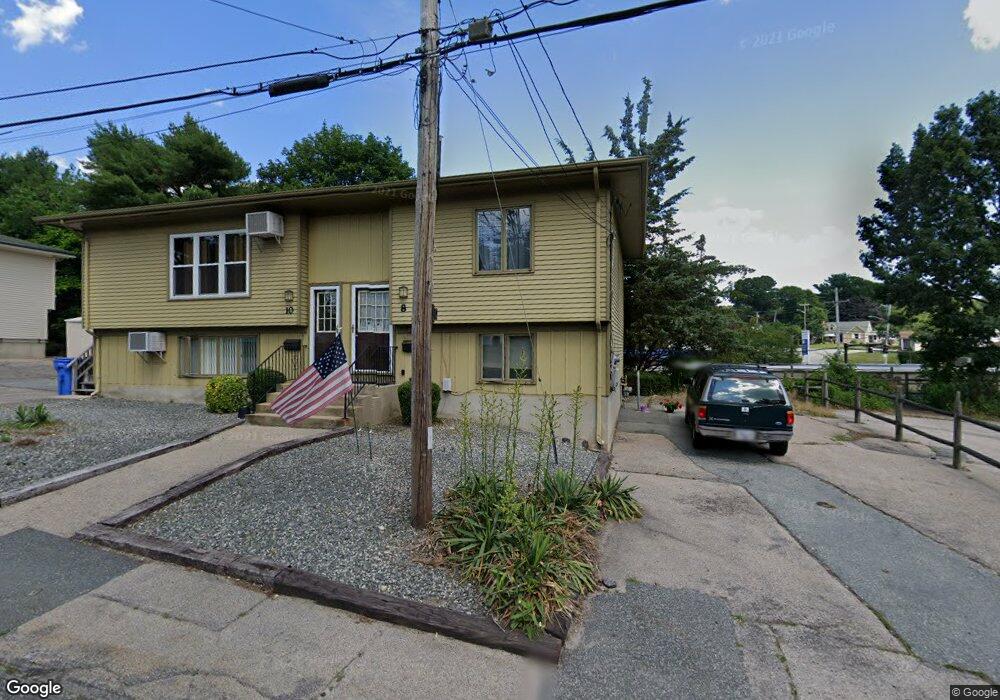
8 Vinton Ave Unit 10 Cranston, RI 02920
Oaklawn NeighborhoodEstimated Value: $440,769 - $558,000
4
Beds
2
Baths
1,208
Sq Ft
$429/Sq Ft
Est. Value
About This Home
This home is located at 8 Vinton Ave Unit 10, Cranston, RI 02920 and is currently estimated at $518,192, approximately $428 per square foot. 8 Vinton Ave Unit 10 is a home located in Providence County with nearby schools including Glen Hills School, Western Hills Middle School, and Cranston High School West.
Ownership History
Date
Name
Owned For
Owner Type
Purchase Details
Closed on
Mar 29, 2007
Sold by
Coutu Suzanne and Coutu William
Bought by
Classic Court Re
Current Estimated Value
Home Financials for this Owner
Home Financials are based on the most recent Mortgage that was taken out on this home.
Original Mortgage
$600,000
Outstanding Balance
$364,561
Interest Rate
6.33%
Mortgage Type
Purchase Money Mortgage
Estimated Equity
$153,631
Purchase Details
Closed on
Aug 22, 2005
Sold by
Demers William J and Demers Julie A
Bought by
Coutu William H and Coutu Suzanne
Home Financials for this Owner
Home Financials are based on the most recent Mortgage that was taken out on this home.
Original Mortgage
$239,920
Interest Rate
5.66%
Mortgage Type
Purchase Money Mortgage
Purchase Details
Closed on
Aug 26, 2004
Sold by
Lane Bruce and Lane Mindy
Bought by
Demers William and Demers Julie
Create a Home Valuation Report for This Property
The Home Valuation Report is an in-depth analysis detailing your home's value as well as a comparison with similar homes in the area
Home Values in the Area
Average Home Value in this Area
Purchase History
| Date | Buyer | Sale Price | Title Company |
|---|---|---|---|
| Classic Court Re | $300,000 | -- | |
| Coutu William H | $300,000 | -- | |
| Demers William | $260,000 | -- |
Source: Public Records
Mortgage History
| Date | Status | Borrower | Loan Amount |
|---|---|---|---|
| Open | Demers William | $200,000 | |
| Closed | Demers William | $270,000 | |
| Open | Demers William | $600,000 | |
| Previous Owner | Demers William | $239,920 |
Source: Public Records
Tax History Compared to Growth
Tax History
| Year | Tax Paid | Tax Assessment Tax Assessment Total Assessment is a certain percentage of the fair market value that is determined by local assessors to be the total taxable value of land and additions on the property. | Land | Improvement |
|---|---|---|---|---|
| 2025 | $5,505 | $396,600 | $112,800 | $283,800 |
| 2024 | $5,398 | $396,600 | $112,800 | $283,800 |
| 2023 | $5,052 | $267,300 | $74,300 | $193,000 |
| 2022 | $4,948 | $267,300 | $74,300 | $193,000 |
| 2021 | $4,811 | $267,300 | $74,300 | $193,000 |
| 2020 | $4,463 | $214,900 | $70,700 | $144,200 |
| 2019 | $4,463 | $214,900 | $70,700 | $144,200 |
| 2018 | $4,360 | $214,900 | $70,700 | $144,200 |
| 2017 | $4,253 | $185,400 | $63,600 | $121,800 |
| 2016 | $4,162 | $185,400 | $63,600 | $121,800 |
| 2015 | $4,162 | $185,400 | $63,600 | $121,800 |
| 2014 | $4,294 | $188,000 | $63,600 | $124,400 |
Source: Public Records
Map
Nearby Homes
- 78 Wilbur Ave
- 20 Manilla Ave
- 46 Hornbeam Dr
- 64 Cliffside Dr
- 61 Rose Hill Dr
- 1100 Phenix Ave
- 16 Flynn Ave
- 244 Mayfield Ave Unit F
- 10 East St Unit 316
- 210 Summit Dr
- 100 Priscilla Dr
- 143 Hoffman Ave Unit 206
- 132 Hoffman Ave Unit 115
- 1213 Phenix Ave
- 11 W Blue Ridge Rd
- 7 Oak Tree Ln
- 5 High St
- 175 Hoffman Ave Unit 102
- 7 Squantum St
- 16 Eastman St