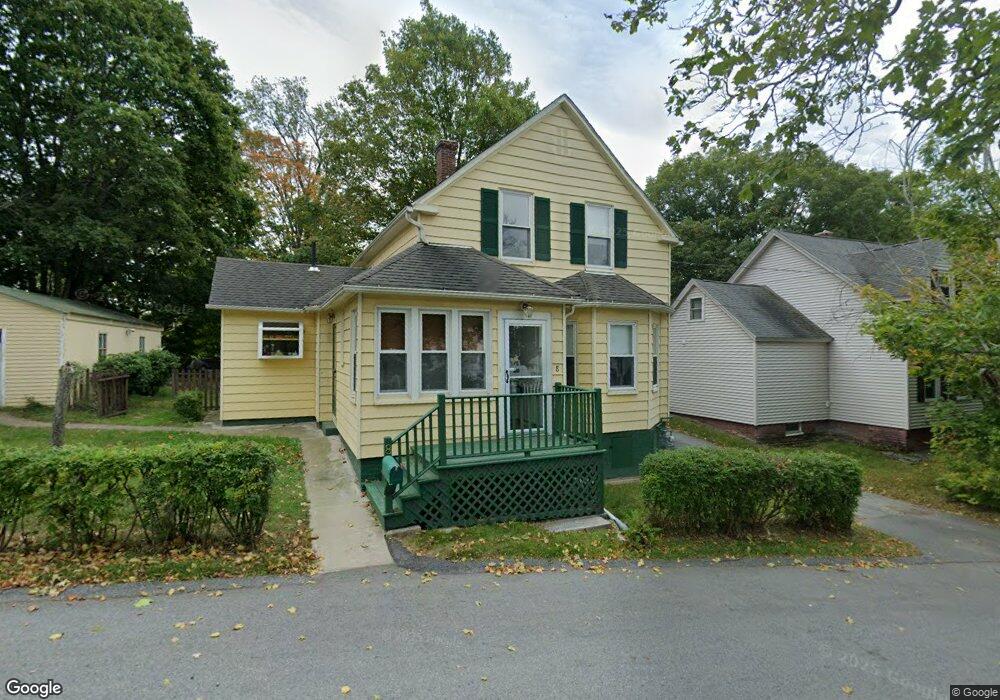
8 W Hampton St Worcester, MA 01610
Pakachoag NeighborhoodEstimated Value: $319,000 - $421,000
3
Beds
1
Bath
1,161
Sq Ft
$316/Sq Ft
Est. Value
About This Home
This home is located at 8 W Hampton St, Worcester, MA 01610 and is currently estimated at $366,568, approximately $315 per square foot. 8 W Hampton St is a home located in Worcester County with nearby schools including Auburn Senior High School and Canterbury Street School.
Ownership History
Date
Name
Owned For
Owner Type
Purchase Details
Closed on
Dec 22, 2005
Sold by
Loew Deanna M and Lucia Deanna M
Bought by
Wickes James R
Current Estimated Value
Home Financials for this Owner
Home Financials are based on the most recent Mortgage that was taken out on this home.
Original Mortgage
$196,000
Outstanding Balance
$110,119
Interest Rate
6.36%
Mortgage Type
Purchase Money Mortgage
Estimated Equity
$256,449
Create a Home Valuation Report for This Property
The Home Valuation Report is an in-depth analysis detailing your home's value as well as a comparison with similar homes in the area
Home Values in the Area
Average Home Value in this Area
Purchase History
| Date | Buyer | Sale Price | Title Company |
|---|---|---|---|
| Wickes James R | $245,000 | -- |
Source: Public Records
Mortgage History
| Date | Status | Borrower | Loan Amount |
|---|---|---|---|
| Open | Wickes James R | $196,000 |
Source: Public Records
Tax History
| Year | Tax Paid | Tax Assessment Tax Assessment Total Assessment is a certain percentage of the fair market value that is determined by local assessors to be the total taxable value of land and additions on the property. | Land | Improvement |
|---|---|---|---|---|
| 2025 | $48 | $336,400 | $113,100 | $223,300 |
| 2024 | $4,906 | $328,600 | $107,300 | $221,300 |
| 2023 | $4,874 | $306,900 | $97,500 | $209,400 |
| 2022 | $4,612 | $274,200 | $97,500 | $176,700 |
| 2021 | $4,169 | $229,800 | $86,000 | $143,800 |
| 2020 | $3,988 | $221,800 | $86,000 | $135,800 |
| 2019 | $3,912 | $212,400 | $85,100 | $127,300 |
| 2018 | $3,616 | $196,100 | $79,600 | $116,500 |
| 2017 | $3,398 | $185,300 | $72,200 | $113,100 |
| 2016 | $2,922 | $161,500 | $68,000 | $93,500 |
| 2015 | $2,525 | $146,300 | $68,000 | $78,300 |
| 2014 | $2,479 | $143,400 | $64,700 | $78,700 |
Source: Public Records
Map
Nearby Homes
- 6 Epworth St
- 73 Sophia Dr
- 1034 Southbridge St
- 6 Newton St
- 6 Beckman St
- 29 Steele St
- 4 Stockholm St
- 30 Ekman St
- 2 Mystic St
- 4 Maxwell Ct
- 26 Maxwell St
- 3A Gediminas St
- 20 Washburn St
- 607 Cambridge St Unit 4
- 103 Illinois St
- 52 Richards St
- 56 Richards St
- 54 Richards St
- 172 Perry Ave Unit 1A
- 172 Perry Ave Unit 2B
Your Personal Tour Guide
Ask me questions while you tour the home.