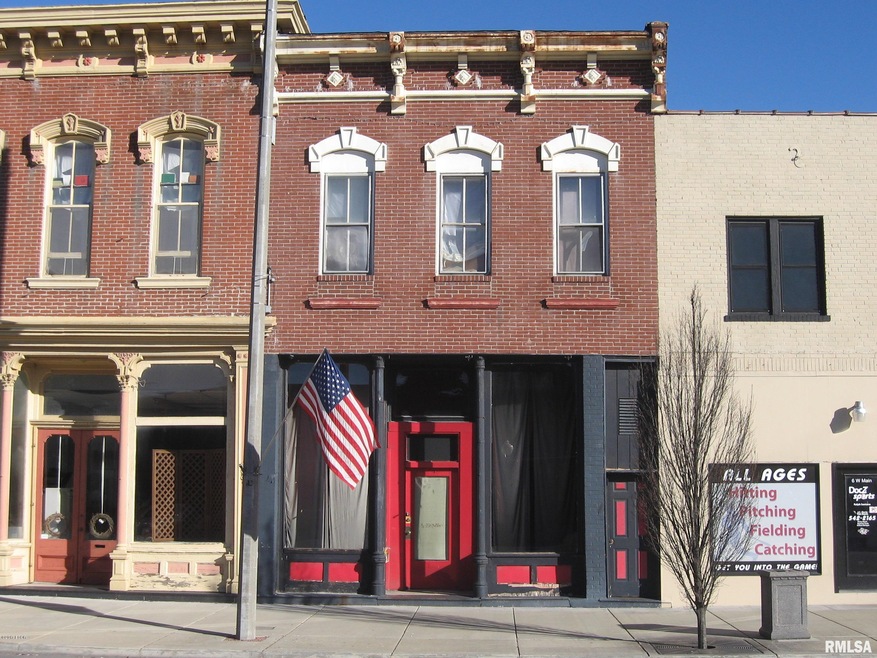
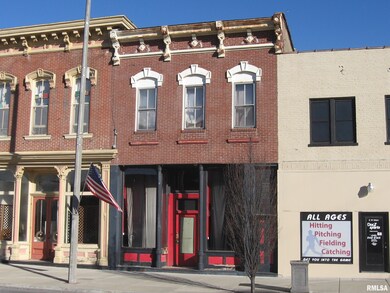
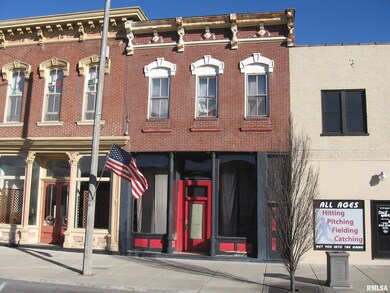
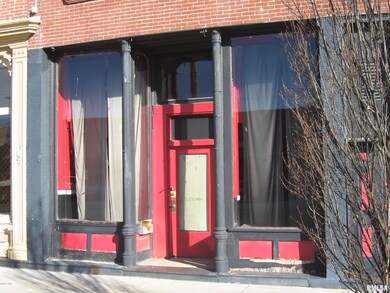
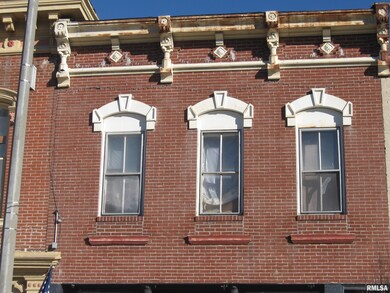
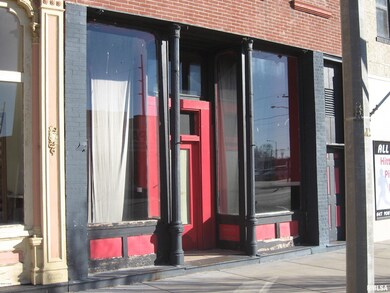
8 W Main St Du Quoin, IL 62832
About This Home
As of September 2018Main Street business location with many possibilities. 2 studio/loft (all electric) apartments upstairs. Separate utilities for each unit. Main storefront on ground level (both gas & electric) There are at least 2 municipal parking lots within 1/2 block of this location.Disclosure: NONE
Last Agent to Sell the Property
Bill Kimmel
SHAMROCK REAL ESTATE DQ License #475126256
Last Buyer's Agent
Bill Kimmel
SHAMROCK REAL ESTATE DQ License #475126256
Property Details
Property Type
- Other
Est. Annual Taxes
- $744
Year Built
- Built in 1896
Utilities
- Central Air
- Heating System Uses Gas
Ownership History
Purchase Details
Home Financials for this Owner
Home Financials are based on the most recent Mortgage that was taken out on this home.Purchase Details
Home Financials for this Owner
Home Financials are based on the most recent Mortgage that was taken out on this home.Purchase Details
Home Financials for this Owner
Home Financials are based on the most recent Mortgage that was taken out on this home.Purchase Details
Map
Home Values in the Area
Average Home Value in this Area
Purchase History
| Date | Type | Sale Price | Title Company |
|---|---|---|---|
| Warranty Deed | $5,833 | -- | |
| Warranty Deed | $13,000 | Attorney | |
| Warranty Deed | $18,000 | None Available | |
| Warranty Deed | $21,500 | None Available |
Mortgage History
| Date | Status | Loan Amount | Loan Type |
|---|---|---|---|
| Previous Owner | $15,000 | Seller Take Back |
Property History
| Date | Event | Price | Change | Sq Ft Price |
|---|---|---|---|---|
| 09/24/2018 09/24/18 | Sold | $17,500 | -40.7% | -- |
| 08/21/2018 08/21/18 | Pending | -- | -- | -- |
| 02/15/2017 02/15/17 | For Sale | $29,500 | +84.4% | -- |
| 04/01/2016 04/01/16 | Sold | $16,000 | -11.1% | -- |
| 12/17/2015 12/17/15 | Pending | -- | -- | -- |
| 05/15/2015 05/15/15 | For Sale | $18,000 | -- | -- |
Tax History
| Year | Tax Paid | Tax Assessment Tax Assessment Total Assessment is a certain percentage of the fair market value that is determined by local assessors to be the total taxable value of land and additions on the property. | Land | Improvement |
|---|---|---|---|---|
| 2023 | $729 | $9,971 | $4,080 | $5,891 |
| 2022 | $830 | $9,094 | $3,721 | $5,373 |
| 2021 | $839 | $8,529 | $3,490 | $5,039 |
| 2020 | $762 | $7,892 | $3,229 | $4,663 |
| 2019 | $744 | $7,662 | $3,135 | $4,527 |
| 2018 | $744 | $7,662 | $3,135 | $4,527 |
| 2017 | $751 | $7,689 | $3,146 | $4,543 |
| 2016 | $743 | $7,519 | $3,077 | $4,442 |
| 2015 | $743 | $7,519 | $3,077 | $4,442 |
| 2013 | $738 | $7,378 | $3,019 | $4,359 |
Source: RMLS Alliance
MLS Number: RMAEB411465
APN: 2-61-1590-090
Disclaimer: Certain information contained herein is derived from information provided by parties other than Homes.com. All information provided is deemed reliable, but is not guaranteed to be accurate and should be independently verified.
![]() IDX information is provided exclusively for personal, non-commercial use, and may not be used for any purpose other than to identify prospective properties consumers may be interested in purchasing. Information is deemed reliable but not guaranteed.
IDX information is provided exclusively for personal, non-commercial use, and may not be used for any purpose other than to identify prospective properties consumers may be interested in purchasing. Information is deemed reliable but not guaranteed.
- 13 N Division St
- 12 N Division St
- 113 N Hickory St
- 115 S Hickory St
- 230 S Mulberry St
- 209 S Walnut St
- 419 W Main St
- 311 E South St
- 507 W Main St
- 401 E Park St
- 213 S Peach St
- 402 E Keyes St
- 522 S Washington St
- 535 E Main St
- 111 S Line St
- 210 & 214 N Oak St
- 519 N Maple St
- 0000 Sunset Ave
- 116 East
- 116 S Ballentine Ave