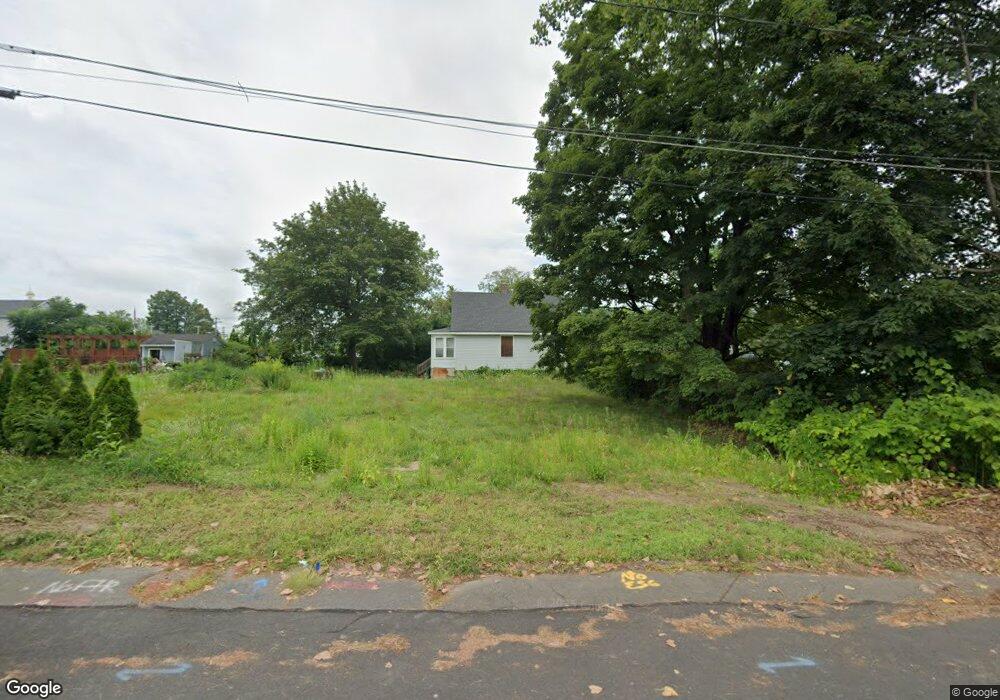
8 Warriner Ave Enfield, CT 06082
Estimated Value: $160,215 - $242,000
1
Bed
1
Bath
624
Sq Ft
$346/Sq Ft
Est. Value
About This Home
This home is located at 8 Warriner Ave, Enfield, CT 06082 and is currently estimated at $215,804, approximately $345 per square foot. 8 Warriner Ave is a home located in Hartford County with nearby schools including Henry Barnard Elementary School, Prudence Crandall Elementary School, and John F. Kennedy Middle School.
Ownership History
Date
Name
Owned For
Owner Type
Purchase Details
Closed on
Nov 9, 2015
Sold by
Enfield Properties Llc
Bought by
Cekala Kathryn and Cekala Jay
Current Estimated Value
Home Financials for this Owner
Home Financials are based on the most recent Mortgage that was taken out on this home.
Original Mortgage
$60,000
Interest Rate
3%
Purchase Details
Closed on
Oct 18, 2005
Sold by
Wojnar Janice
Bought by
Enfield Properties Llc
Purchase Details
Closed on
Oct 20, 1999
Sold by
Est Wojnar Victoria and Bass Walter
Bought by
Troiano Frank J
Create a Home Valuation Report for This Property
The Home Valuation Report is an in-depth analysis detailing your home's value as well as a comparison with similar homes in the area
Home Values in the Area
Average Home Value in this Area
Purchase History
| Date | Buyer | Sale Price | Title Company |
|---|---|---|---|
| Cekala Kathryn | $60,000 | -- | |
| Enfield Properties Llc | $24,500 | -- | |
| Troiano Frank J | $15,000 | -- |
Source: Public Records
Mortgage History
| Date | Status | Borrower | Loan Amount |
|---|---|---|---|
| Closed | Troiano Frank J | $60,000 |
Source: Public Records
Tax History Compared to Growth
Tax History
| Year | Tax Paid | Tax Assessment Tax Assessment Total Assessment is a certain percentage of the fair market value that is determined by local assessors to be the total taxable value of land and additions on the property. | Land | Improvement |
|---|---|---|---|---|
| 2025 | $3,640 | $97,600 | $48,700 | $48,900 |
| 2024 | $3,543 | $97,600 | $48,700 | $48,900 |
| 2023 | $3,543 | $97,600 | $48,700 | $48,900 |
| 2022 | $3,282 | $97,600 | $48,700 | $48,900 |
| 2021 | $2,976 | $72,420 | $40,290 | $32,130 |
| 2020 | $2,947 | $72,420 | $40,290 | $32,130 |
| 2019 | $2,971 | $72,420 | $40,290 | $32,130 |
| 2018 | $2,906 | $72,420 | $40,290 | $32,130 |
| 2017 | $2,656 | $66,790 | $40,290 | $26,500 |
| 2016 | $2,597 | $66,240 | $40,290 | $25,950 |
| 2015 | $2,532 | $66,240 | $40,290 | $25,950 |
| 2014 | $2,410 | $66,240 | $40,290 | $25,950 |
Source: Public Records
Map
Nearby Homes