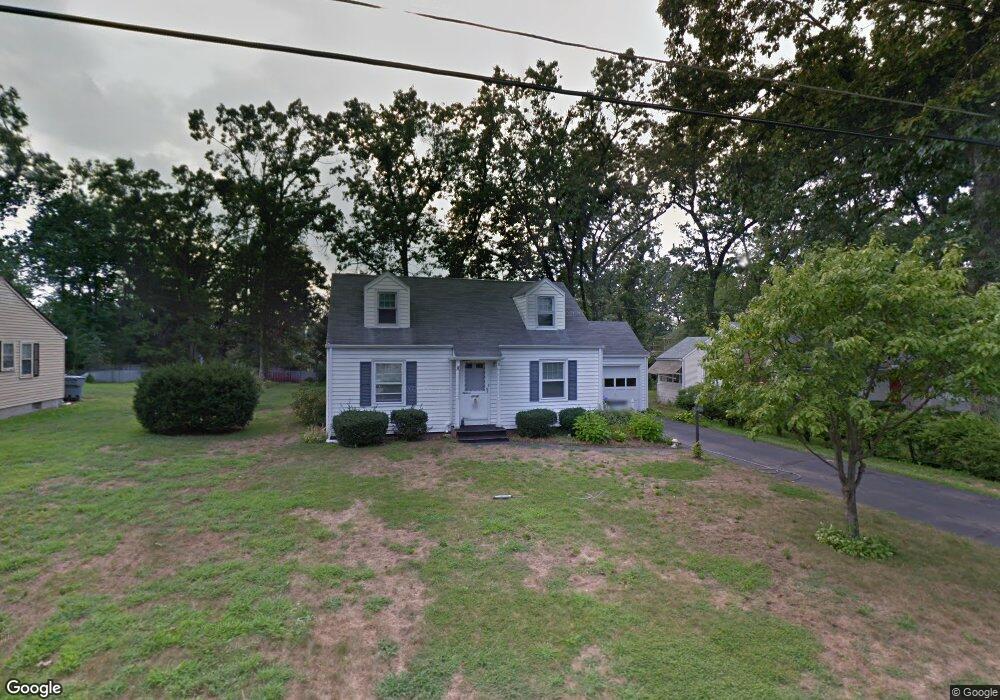
8 Wilstar Cir Enfield, CT 06082
Estimated Value: $273,000 - $317,000
4
Beds
1
Bath
1,200
Sq Ft
$250/Sq Ft
Est. Value
About This Home
This home is located at 8 Wilstar Cir, Enfield, CT 06082 and is currently estimated at $300,361, approximately $250 per square foot. 8 Wilstar Cir is a home located in Hartford County with nearby schools including Eli Whitney Elementary School, Hazardville Memorial Elementary School, and John F. Kennedy Middle School.
Ownership History
Date
Name
Owned For
Owner Type
Purchase Details
Closed on
Sep 3, 2020
Sold by
Dynia Jeff
Bought by
Locke Rebecca M
Current Estimated Value
Home Financials for this Owner
Home Financials are based on the most recent Mortgage that was taken out on this home.
Original Mortgage
$176,928
Outstanding Balance
$157,300
Interest Rate
3%
Mortgage Type
New Conventional
Estimated Equity
$143,061
Purchase Details
Closed on
Sep 15, 2005
Sold by
Dynia Stanley and Dynia Stella
Bought by
Dynia Jef
Create a Home Valuation Report for This Property
The Home Valuation Report is an in-depth analysis detailing your home's value as well as a comparison with similar homes in the area
Home Values in the Area
Average Home Value in this Area
Purchase History
| Date | Buyer | Sale Price | Title Company |
|---|---|---|---|
| Locke Rebecca M | $182,400 | None Available | |
| Dynia Jef | $189,900 | -- |
Source: Public Records
Mortgage History
| Date | Status | Borrower | Loan Amount |
|---|---|---|---|
| Open | Locke Rebecca M | $176,928 | |
| Previous Owner | Dynia Jef | $137,807 | |
| Previous Owner | Dynia Jef | $16,000 | |
| Previous Owner | Dynia Jef | $18,000 |
Source: Public Records
Tax History Compared to Growth
Tax History
| Year | Tax Paid | Tax Assessment Tax Assessment Total Assessment is a certain percentage of the fair market value that is determined by local assessors to be the total taxable value of land and additions on the property. | Land | Improvement |
|---|---|---|---|---|
| 2025 | $4,517 | $128,700 | $46,900 | $81,800 |
| 2024 | $4,351 | $128,700 | $46,900 | $81,800 |
| 2023 | $4,319 | $128,700 | $46,900 | $81,800 |
| 2022 | $3,976 | $128,700 | $46,900 | $81,800 |
| 2021 | $3,868 | $102,950 | $38,860 | $64,090 |
| 2020 | $3,842 | $102,950 | $38,860 | $64,090 |
| 2019 | $3,837 | $102,950 | $38,860 | $64,090 |
| 2018 | $3,734 | $102,950 | $38,860 | $64,090 |
| 2017 | $3,509 | $102,950 | $38,860 | $64,090 |
| 2016 | $3,537 | $106,030 | $38,860 | $67,170 |
| 2015 | $3,429 | $106,030 | $38,860 | $67,170 |
| 2014 | $3,343 | $106,030 | $38,860 | $67,170 |
Source: Public Records
Map
Nearby Homes
- 83 Oldefield Farms Unit 83
- 85 Oldefield Farms Unit 85
- 3 Avon Street Extension
- 287 Hazard Ave
- 6 Cedar St
- 46 Beech Rd
- 10-1/2 South Rd
- 33 Liberty Ln
- 38 Liberty Ln
- 52 Liberty Ln
- 37 Liberty Ln
- 35 Liberty Ln
- 56 N Maple St
- 34 Ridgefield Rd
- 23 Clear St
- 4 Georgetown Unit A
- 102 N Maple St Unit 1A
- 84 Raffia Rd
- 4 Bradley Cir Unit D
- 20 Howard St