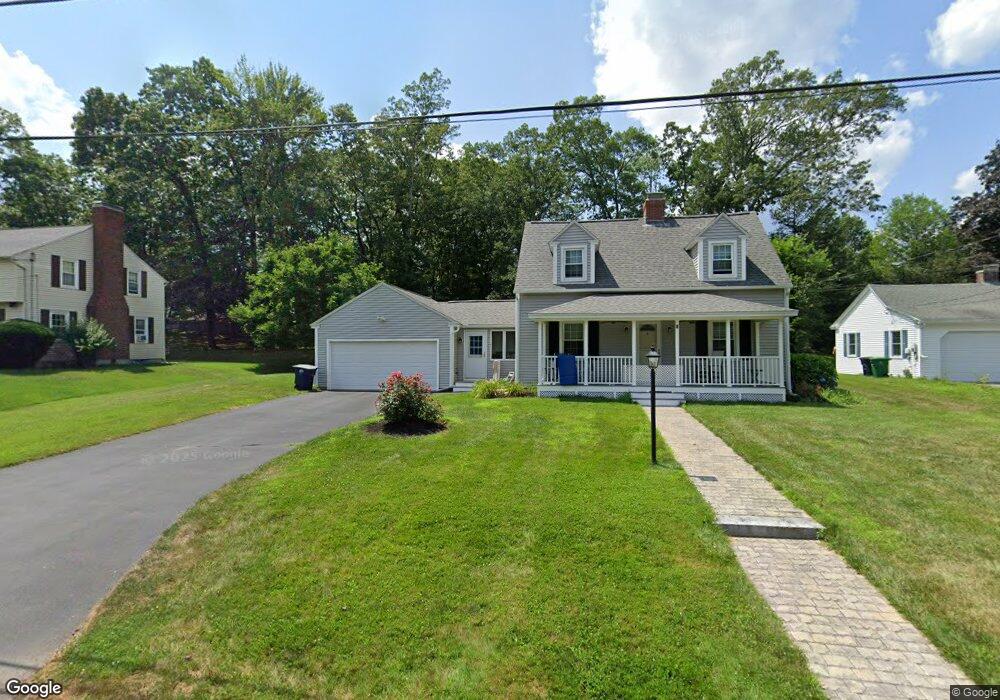
8 Wood St Nashua, NH 03064
North End Nashua NeighborhoodEstimated Value: $424,000 - $519,223
2
Beds
2
Baths
1,407
Sq Ft
$347/Sq Ft
Est. Value
About This Home
This home is located at 8 Wood St, Nashua, NH 03064 and is currently estimated at $488,306, approximately $347 per square foot. 8 Wood St is a home located in Hillsborough County with nearby schools including Mount Pleasant Elementary School, Pennichuck Middle School, and Nashua High School North.
Ownership History
Date
Name
Owned For
Owner Type
Purchase Details
Closed on
Aug 3, 2022
Sold by
Letourneau Elizabeth M
Bought by
Letourneau Elizabeth M and Gemmell Louise M
Current Estimated Value
Purchase Details
Closed on
Jun 30, 1997
Sold by
James H Stone T
Bought by
Letourneau Elizabeth M
Home Financials for this Owner
Home Financials are based on the most recent Mortgage that was taken out on this home.
Original Mortgage
$133,650
Interest Rate
7.81%
Mortgage Type
Purchase Money Mortgage
Create a Home Valuation Report for This Property
The Home Valuation Report is an in-depth analysis detailing your home's value as well as a comparison with similar homes in the area
Home Values in the Area
Average Home Value in this Area
Purchase History
| Date | Buyer | Sale Price | Title Company |
|---|---|---|---|
| Letourneau Elizabeth M | -- | None Available | |
| Letourneau Elizabeth M | $148,500 | -- |
Source: Public Records
Mortgage History
| Date | Status | Borrower | Loan Amount |
|---|---|---|---|
| Previous Owner | Letourneau Elizabeth M | $75,000 | |
| Previous Owner | Letourneau Elizabeth M | $133,650 |
Source: Public Records
Tax History Compared to Growth
Tax History
| Year | Tax Paid | Tax Assessment Tax Assessment Total Assessment is a certain percentage of the fair market value that is determined by local assessors to be the total taxable value of land and additions on the property. | Land | Improvement |
|---|---|---|---|---|
| 2024 | $7,991 | $502,600 | $170,500 | $332,100 |
| 2023 | $7,575 | $415,500 | $136,400 | $279,100 |
| 2022 | $7,508 | $415,500 | $136,400 | $279,100 |
| 2021 | $6,790 | $292,400 | $109,100 | $183,300 |
| 2020 | $6,616 | $292,600 | $109,100 | $183,500 |
| 2019 | $6,367 | $292,600 | $109,100 | $183,500 |
| 2018 | $6,202 | $292,400 | $109,100 | $183,300 |
| 2017 | $6,386 | $247,600 | $96,600 | $151,000 |
| 2016 | $6,207 | $247,600 | $96,600 | $151,000 |
| 2015 | $6,074 | $247,600 | $96,600 | $151,000 |
| 2014 | $5,955 | $247,600 | $96,600 | $151,000 |
Source: Public Records
Map
Nearby Homes
- 36-38 Courtland St
- 71 Concord St
- 19 Atherton Ave
- 15 Atherton Ave
- 13 Sapphire Ln
- 21 Edson St
- 4 Reservoir St
- 61 Manchester St
- 73 Berkeley St
- 19 Bartlett Ave
- 9 Doveton Ln Unit B
- 31 Juliana Ave
- 31 Juliana Ave Unit 4
- 11 Charles St
- 11 Juliana Ave Unit 52
- 3 Opal Way Unit 3
- 1 Opal Way Unit 1
- 2 Opal Way Unit 2
- 12 Juliana Ave Unit 14
- 434 Abbott Farm Ln