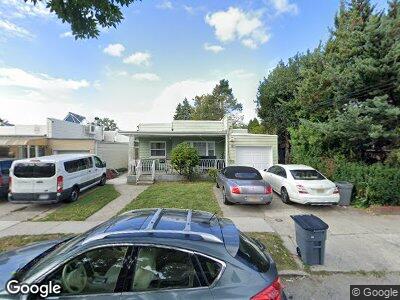
80-18 169th St Jamaica, NY 11432
Hillcrest NeighborhoodEstimated Value: $777,746 - $812,000
4
Beds
2
Baths
844
Sq Ft
$935/Sq Ft
Est. Value
About This Home
This home is located at 80-18 169th St, Jamaica, NY 11432 and is currently estimated at $789,187, approximately $935 per square foot. 80-18 169th St is a home located in Queens County with nearby schools including P.S. 131 - Abigail Adams, George J. Ryan Middle School 216, and St. Nicholas of Tolentine Catholic Academy.
Ownership History
Date
Name
Owned For
Owner Type
Purchase Details
Closed on
Aug 15, 2006
Sold by
Stamm Brian and Stamm Gouzalia
Bought by
Shamayev Vyacheslav
Current Estimated Value
Home Financials for this Owner
Home Financials are based on the most recent Mortgage that was taken out on this home.
Original Mortgage
$56,500
Outstanding Balance
$35,084
Interest Rate
6.83%
Estimated Equity
$735,672
Purchase Details
Closed on
Nov 1, 2001
Sold by
Katz Howard M and Katz Sharon L
Bought by
Stamm Brian and Stamm Gouzalia
Home Financials for this Owner
Home Financials are based on the most recent Mortgage that was taken out on this home.
Original Mortgage
$228,000
Interest Rate
6.6%
Create a Home Valuation Report for This Property
The Home Valuation Report is an in-depth analysis detailing your home's value as well as a comparison with similar homes in the area
Home Values in the Area
Average Home Value in this Area
Purchase History
| Date | Buyer | Sale Price | Title Company |
|---|---|---|---|
| Shamayev Vyacheslav | $510,000 | -- | |
| Shamayev Vyacheslav | $510,000 | -- | |
| Stamm Brian | -- | -- | |
| Stamm Brian | -- | -- |
Source: Public Records
Mortgage History
| Date | Status | Borrower | Loan Amount |
|---|---|---|---|
| Open | Shamayev Vyacheslav | $8,907 | |
| Open | Shamayev Vyacheslav | $56,500 | |
| Closed | Shamayev Vyacheslav | $56,500 | |
| Open | Shamayev Vyacheslav | $408,000 | |
| Closed | Shamayev Vyacheslav | $408,000 | |
| Previous Owner | Stamm Brian | $103,562 | |
| Previous Owner | Stamm Brian | $36,000 | |
| Previous Owner | Stamm Brian | $39,000 | |
| Previous Owner | Stamm Brian | $228,000 |
Source: Public Records
Tax History Compared to Growth
Tax History
| Year | Tax Paid | Tax Assessment Tax Assessment Total Assessment is a certain percentage of the fair market value that is determined by local assessors to be the total taxable value of land and additions on the property. | Land | Improvement |
|---|---|---|---|---|
| 2024 | $6,933 | $35,858 | $13,899 | $21,959 |
| 2023 | $6,921 | $35,858 | $11,853 | $24,005 |
| 2022 | $6,560 | $42,300 | $14,280 | $28,020 |
| 2021 | $6,545 | $39,994 | $14,280 | $25,714 |
| 2020 | $5,673 | $37,140 | $14,280 | $22,860 |
| 2019 | $5,502 | $39,000 | $14,280 | $24,720 |
| 2018 | $5,349 | $27,702 | $10,791 | $16,911 |
| 2017 | $5,083 | $26,403 | $9,282 | $17,121 |
| 2016 | $4,670 | $26,403 | $9,282 | $17,121 |
| 2015 | $2,784 | $23,500 | $12,661 | $10,839 |
| 2014 | $2,784 | $23,085 | $13,851 | $9,234 |
Source: Public Records
Map
Nearby Homes
- 168-7 81st Ave
- 81-15 169th St
- 78-07 166th St
- 81-43 169th St
- 76-45 167th St
- 164-35 77th Rd
- 16444 81st Ave
- 76-21 167th St
- 164-38 77th Ave
- 81-19 164th Place
- 164-34 77th Ave
- 7636 173rd St
- 7662 174th St
- 76-47 173rd St
- 164-33 76th Rd
- 78-40 164th St Unit 3J
- 82-60 166th St
- 78-39 162nd St
- 162-33 76th Rd
- 73-20 170th St
- 80-18 169th St
- 80-18 169th St
- 80-18 169th St
- 80-18 169th St
- 80-18 169th St
- 80-18 169th St
- 80-18 169th St
- 80-18 169th St
- 80-18 169th St
- 8018 169th St
- 8022 169th St
- 8014 169th St
- 80-30 169th St
- 8026 169th St
- 80-15 168th St
- 8015 168th St
- 80-19 168th St Unit House
- 8019 168th St
- 8011 168th St
- 8030 169th St