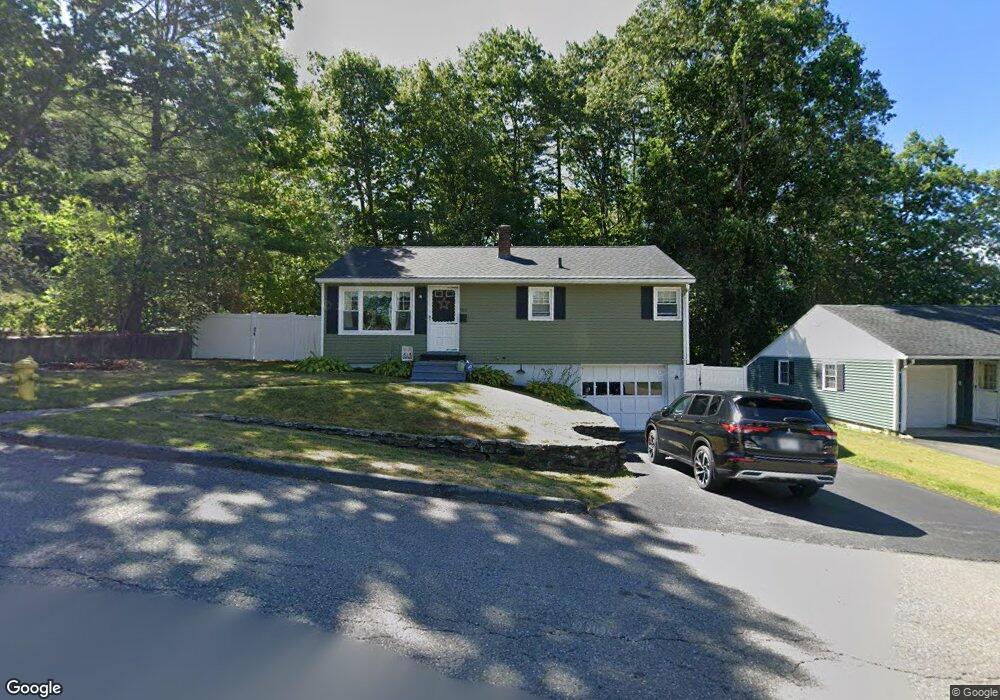
80 Allen St Gardner, MA 01440
Estimated Value: $314,000 - $366,000
3
Beds
1
Bath
912
Sq Ft
$369/Sq Ft
Est. Value
About This Home
This home is located at 80 Allen St, Gardner, MA 01440 and is currently estimated at $336,856, approximately $369 per square foot. 80 Allen St is a home located in Worcester County with nearby schools including Gardner High School, Holy Family Academy, and Wachusett Hills Christian School.
Ownership History
Date
Name
Owned For
Owner Type
Purchase Details
Closed on
Jul 10, 2015
Sold by
Cali Matthew L
Bought by
Cali Christopher J
Current Estimated Value
Home Financials for this Owner
Home Financials are based on the most recent Mortgage that was taken out on this home.
Original Mortgage
$126,303
Outstanding Balance
$98,518
Interest Rate
3.87%
Mortgage Type
New Conventional
Estimated Equity
$238,338
Purchase Details
Closed on
Apr 6, 2009
Sold by
Kymalainen Josephine M
Bought by
Cali Matthew L and Cali Christopher
Home Financials for this Owner
Home Financials are based on the most recent Mortgage that was taken out on this home.
Original Mortgage
$142,800
Interest Rate
4.92%
Mortgage Type
Purchase Money Mortgage
Create a Home Valuation Report for This Property
The Home Valuation Report is an in-depth analysis detailing your home's value as well as a comparison with similar homes in the area
Home Values in the Area
Average Home Value in this Area
Purchase History
| Date | Buyer | Sale Price | Title Company |
|---|---|---|---|
| Cali Christopher J | -- | -- | |
| Cali Matthew L | $140,000 | -- |
Source: Public Records
Mortgage History
| Date | Status | Borrower | Loan Amount |
|---|---|---|---|
| Open | Cali Christopher J | $126,303 | |
| Previous Owner | Cali Matthew L | $142,800 |
Source: Public Records
Tax History Compared to Growth
Tax History
| Year | Tax Paid | Tax Assessment Tax Assessment Total Assessment is a certain percentage of the fair market value that is determined by local assessors to be the total taxable value of land and additions on the property. | Land | Improvement |
|---|---|---|---|---|
| 2025 | $40 | $280,900 | $74,000 | $206,900 |
| 2024 | $3,917 | $261,300 | $67,300 | $194,000 |
| 2023 | $3,634 | $225,300 | $66,300 | $159,000 |
| 2022 | $3,359 | $180,700 | $50,200 | $130,500 |
| 2021 | $3,261 | $162,700 | $43,700 | $119,000 |
| 2020 | $3,121 | $158,100 | $43,700 | $114,400 |
| 2019 | $2,953 | $146,600 | $43,700 | $102,900 |
| 2018 | $2,809 | $138,600 | $43,700 | $94,900 |
| 2017 | $2,699 | $131,800 | $43,700 | $88,100 |
| 2016 | $2,579 | $126,000 | $43,700 | $82,300 |
| 2015 | -- | $124,800 | $43,700 | $81,100 |
| 2014 | $2,442 | $129,400 | $50,700 | $78,700 |
Source: Public Records
Map
Nearby Homes