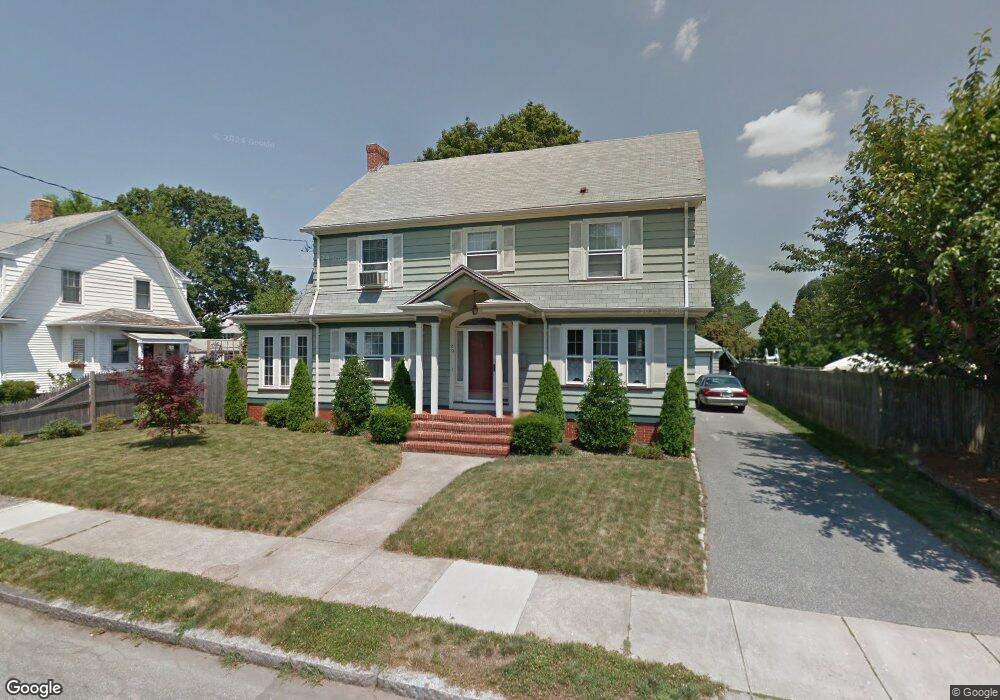
80 Brandon Rd Cranston, RI 02910
Estimated Value: $539,000 - $779,000
4
Beds
2
Baths
2,766
Sq Ft
$226/Sq Ft
Est. Value
About This Home
This home is located at 80 Brandon Rd, Cranston, RI 02910 and is currently estimated at $625,080, approximately $225 per square foot. 80 Brandon Rd is a home located in Providence County with nearby schools including W. R. Dutemple School, Park View Middle School, and Cranston High School East.
Ownership History
Date
Name
Owned For
Owner Type
Purchase Details
Closed on
Mar 6, 1998
Sold by
Rotatori James D
Bought by
Mulcahy Michael J and Mulcahy Donna
Current Estimated Value
Home Financials for this Owner
Home Financials are based on the most recent Mortgage that was taken out on this home.
Original Mortgage
$136,750
Interest Rate
6.93%
Purchase Details
Closed on
Nov 30, 1989
Sold by
Santonastaso Albert
Bought by
Rotatori James D
Home Financials for this Owner
Home Financials are based on the most recent Mortgage that was taken out on this home.
Original Mortgage
$112,800
Interest Rate
9.82%
Create a Home Valuation Report for This Property
The Home Valuation Report is an in-depth analysis detailing your home's value as well as a comparison with similar homes in the area
Home Values in the Area
Average Home Value in this Area
Purchase History
| Date | Buyer | Sale Price | Title Company |
|---|---|---|---|
| Mulcahy Michael J | $145,000 | -- | |
| Rotatori James D | $141,000 | -- |
Source: Public Records
Mortgage History
| Date | Status | Borrower | Loan Amount |
|---|---|---|---|
| Open | Rotatori James D | $130,000 | |
| Closed | Rotatori James D | $38,000 | |
| Closed | Rotatori James D | $136,750 | |
| Previous Owner | Rotatori James D | $112,800 |
Source: Public Records
Tax History Compared to Growth
Tax History
| Year | Tax Paid | Tax Assessment Tax Assessment Total Assessment is a certain percentage of the fair market value that is determined by local assessors to be the total taxable value of land and additions on the property. | Land | Improvement |
|---|---|---|---|---|
| 2025 | $6,819 | $491,300 | $114,700 | $376,600 |
| 2024 | $6,687 | $491,300 | $114,700 | $376,600 |
| 2023 | $6,577 | $348,000 | $75,600 | $272,400 |
| 2022 | $6,441 | $348,000 | $75,600 | $272,400 |
| 2021 | $6,264 | $348,000 | $75,600 | $272,400 |
| 2020 | $5,936 | $285,800 | $72,000 | $213,800 |
| 2019 | $5,936 | $285,800 | $72,000 | $213,800 |
| 2018 | $5,799 | $285,800 | $72,000 | $213,800 |
| 2017 | $6,013 | $262,100 | $64,800 | $197,300 |
| 2016 | $5,884 | $262,100 | $64,800 | $197,300 |
| 2015 | $5,884 | $262,100 | $64,800 | $197,300 |
| 2014 | $5,322 | $233,000 | $64,800 | $168,200 |
Source: Public Records
Map
Nearby Homes