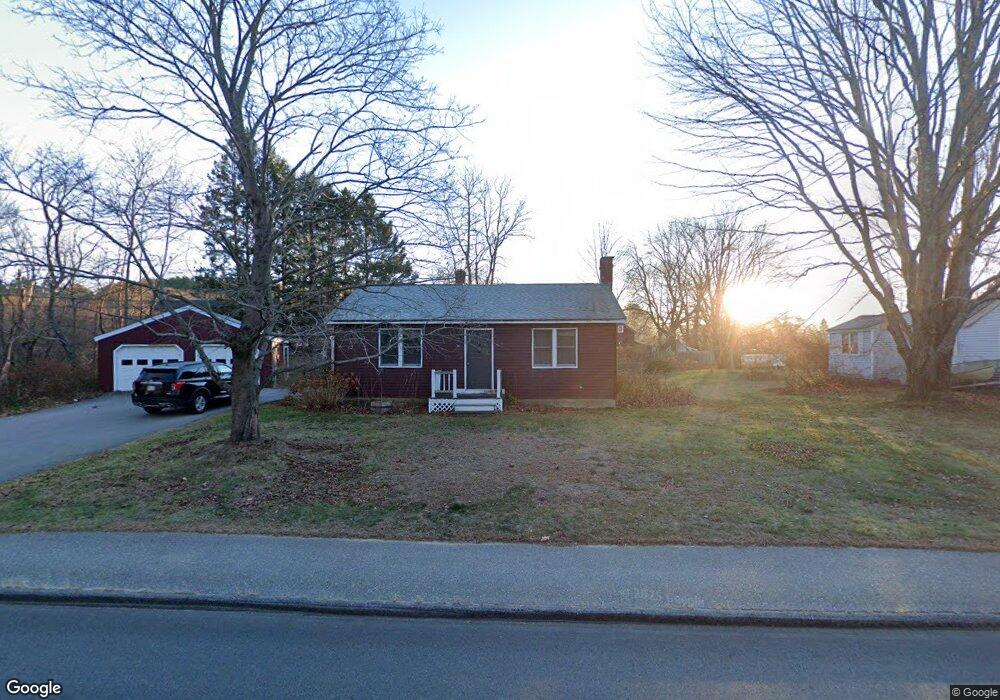
80 Bridge St Topsham, ME 04086
Estimated Value: $399,000 - $483,000
3
Beds
2
Baths
1,392
Sq Ft
$310/Sq Ft
Est. Value
About This Home
This home is located at 80 Bridge St, Topsham, ME 04086 and is currently estimated at $430,825, approximately $309 per square foot. 80 Bridge St is a home located in Sagadahoc County with nearby schools including Mt Ararat High School, Harpswell Coastal Academy Divisions 2 and 3, and St. John's Catholic School.
Ownership History
Date
Name
Owned For
Owner Type
Purchase Details
Closed on
Jun 15, 2023
Sold by
Moore Ada B
Bought by
Jones Caitlin B
Current Estimated Value
Home Financials for this Owner
Home Financials are based on the most recent Mortgage that was taken out on this home.
Original Mortgage
$182,000
Outstanding Balance
$177,133
Interest Rate
6.39%
Mortgage Type
Purchase Money Mortgage
Estimated Equity
$253,692
Create a Home Valuation Report for This Property
The Home Valuation Report is an in-depth analysis detailing your home's value as well as a comparison with similar homes in the area
Home Values in the Area
Average Home Value in this Area
Purchase History
| Date | Buyer | Sale Price | Title Company |
|---|---|---|---|
| Jones Caitlin B | $235,000 | None Available |
Source: Public Records
Mortgage History
| Date | Status | Borrower | Loan Amount |
|---|---|---|---|
| Open | Jones Caitlin B | $182,000 |
Source: Public Records
Tax History Compared to Growth
Tax History
| Year | Tax Paid | Tax Assessment Tax Assessment Total Assessment is a certain percentage of the fair market value that is determined by local assessors to be the total taxable value of land and additions on the property. | Land | Improvement |
|---|---|---|---|---|
| 2024 | $4,646 | $371,700 | $78,400 | $293,300 |
| 2023 | $4,415 | $325,100 | $74,900 | $250,200 |
| 2022 | $4,028 | $279,300 | $69,400 | $209,900 |
| 2021 | $4,023 | $253,500 | $63,800 | $189,700 |
| 2020 | $3,927 | $219,900 | $63,800 | $156,100 |
| 2019 | $3,930 | $205,200 | $61,200 | $144,000 |
| 2018 | $2,941 | $183,000 | $47,900 | $135,100 |
| 2017 | $3,316 | $183,000 | $47,900 | $135,100 |
| 2016 | $3,267 | $181,600 | $47,900 | $133,700 |
| 2015 | $3,186 | $177,400 | $47,900 | $129,500 |
| 2014 | $3,050 | $176,000 | $47,900 | $128,100 |
| 2013 | $2,930 | $176,000 | $47,900 | $128,100 |
Source: Public Records
Map
Nearby Homes
- 29 Winter St
- 57 Winter St
- 44 Forest Glen Ln
- 28 Forest Glen Ln
- 4 Wilson St
- 43 Forest Glen Ln
- 118 Main St
- 23 Forest Glen Ln
- 17 Middle St
- 67 Forest Glen Ln
- 22 Oak St Unit 2
- 22 Oak St Unit 1
- 19 Mason St
- 14 Patricia Dr
- 22 Cedar St
- 26 Union Park Rd
- 86 Merrymeeting Rd
- 87 River Rd
- 132 Pleasant St
- 3 Nugget Ln Unit 3