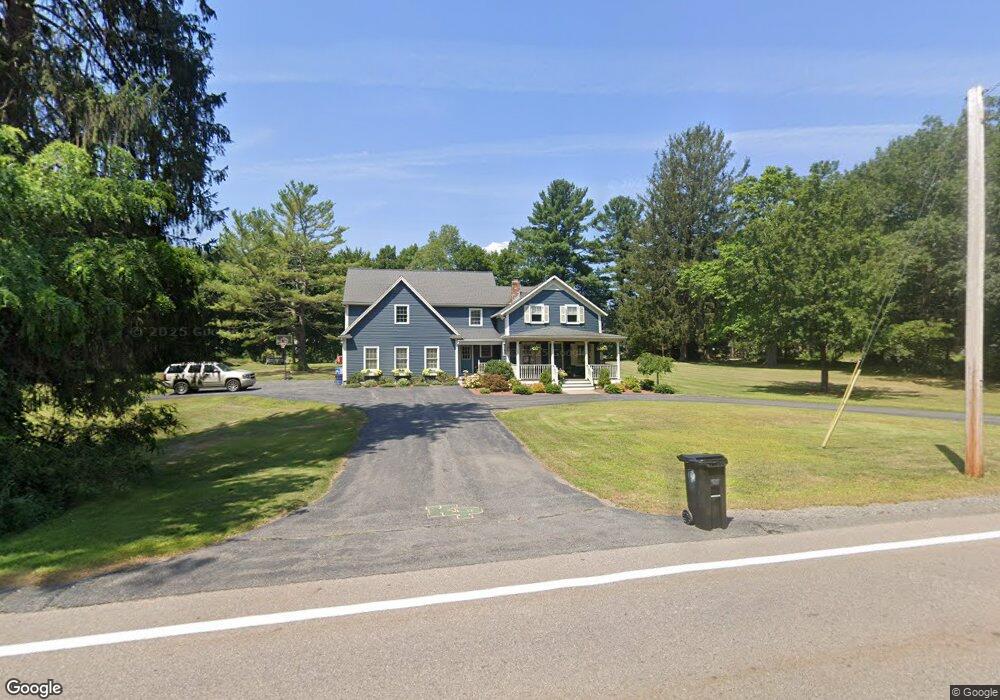
80 Cumberland Rd Wrentham, MA 02093
West Wrentham NeighborhoodEstimated Value: $723,000 - $877,000
3
Beds
3
Baths
2,404
Sq Ft
$332/Sq Ft
Est. Value
About This Home
This home is located at 80 Cumberland Rd, Wrentham, MA 02093 and is currently estimated at $799,031, approximately $332 per square foot. 80 Cumberland Rd is a home located in Norfolk County with nearby schools including Delaney Elementary School, Charles E Roderick, and Benjamin Franklin Classical Charter Public School.
Ownership History
Date
Name
Owned For
Owner Type
Purchase Details
Closed on
Jun 30, 1997
Sold by
Milos Jacqueline L
Bought by
Hagen Ross A and Hagen Elaine F
Current Estimated Value
Home Financials for this Owner
Home Financials are based on the most recent Mortgage that was taken out on this home.
Original Mortgage
$129,600
Interest Rate
7.81%
Mortgage Type
Purchase Money Mortgage
Create a Home Valuation Report for This Property
The Home Valuation Report is an in-depth analysis detailing your home's value as well as a comparison with similar homes in the area
Home Values in the Area
Average Home Value in this Area
Purchase History
| Date | Buyer | Sale Price | Title Company |
|---|---|---|---|
| Hagen Ross A | $162,000 | -- |
Source: Public Records
Mortgage History
| Date | Status | Borrower | Loan Amount |
|---|---|---|---|
| Open | Hagen Ross A | $225,000 | |
| Closed | Hagen Ross A | $129,600 |
Source: Public Records
Tax History Compared to Growth
Tax History
| Year | Tax Paid | Tax Assessment Tax Assessment Total Assessment is a certain percentage of the fair market value that is determined by local assessors to be the total taxable value of land and additions on the property. | Land | Improvement |
|---|---|---|---|---|
| 2025 | $8,626 | $744,300 | $276,600 | $467,700 |
| 2024 | $8,270 | $689,200 | $276,600 | $412,600 |
| 2023 | $8,487 | $672,500 | $251,700 | $420,800 |
| 2022 | $8,165 | $597,300 | $244,800 | $352,500 |
| 2021 | $8,113 | $576,600 | $228,800 | $347,800 |
| 2020 | $7,212 | $506,100 | $174,700 | $331,400 |
| 2019 | $7,016 | $496,900 | $174,700 | $322,200 |
| 2018 | $6,716 | $471,600 | $174,500 | $297,100 |
| 2017 | $6,588 | $462,300 | $171,100 | $291,200 |
| 2016 | $6,292 | $440,600 | $166,200 | $274,400 |
| 2015 | $5,815 | $388,200 | $159,700 | $228,500 |
| 2014 | $5,723 | $373,800 | $153,600 | $220,200 |
Source: Public Records
Map
Nearby Homes
- 50 Heather Ln
- 60 Grant Ave
- 39 Sumner Brown Rd
- 50 Wamsutta Way
- 236 Williams St
- 2095 West St
- 180 Pine Swamp Rd
- 56 Pine Swamp Rd
- 4 Evans St
- 300 Tower Hill Rd
- 4022 Diamond Hill Rd
- 25 Nature View Dr
- 11 Amber Dr
- 20 Nature View Dr
- 17 Stanford Rd
- 51 Reservoir Rd
- 955 Summer St
- 80 Carriage House Ln
- 10 Stanford Rd
- 851 Washington St
- 87 Cumberland Rd
- 10 Heather Ln
- 10 Comstock Dr
- 44 Ray Rd
- 20 Heather Ln
- 15 Heather Ln
- 77 Cumberland Rd
- 0 Lot 5 Comstock Unit 50357240
- 5 Comstock Dr
- 57 Ray Rd
- 133 Cumberland Rd
- 25 Heather Ln
- 30 Heather Ln
- 15 Comstock Dr
- 145 Cumberland Rd
- 41 Ray Rd
- 26 Ray Rd
- 50 Cumberland Rd
- 30 Comstock Dr
- 155 Cumberland Rd