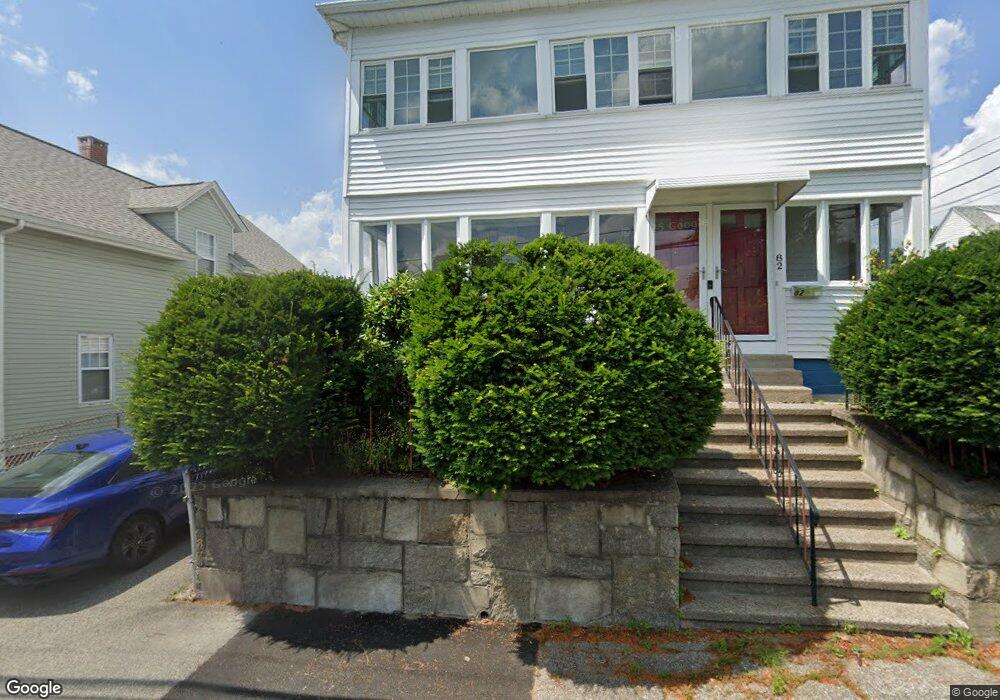
80 Dexter St Cumberland, RI 02864
Valley Falls NeighborhoodEstimated Value: $542,514 - $596,000
6
Beds
3
Baths
2,632
Sq Ft
$213/Sq Ft
Est. Value
About This Home
This home is located at 80 Dexter St, Cumberland, RI 02864 and is currently estimated at $561,129, approximately $213 per square foot. 80 Dexter St is a home located in Providence County with nearby schools including B.F. Norton Elementary School, Joseph L. McCourt Middle School, and Cumberland High School.
Ownership History
Date
Name
Owned For
Owner Type
Purchase Details
Closed on
Oct 18, 2022
Sold by
Afonso Joseph
Bought by
Joseph & Linda Afonso Ret
Current Estimated Value
Purchase Details
Closed on
Mar 10, 2020
Sold by
Gemski Stephanie M
Bought by
Afonso Joseph
Purchase Details
Closed on
Feb 5, 2019
Sold by
Afonso Joseph and Gemski Stephanie M
Bought by
Gemski Stephanie M and Afonso Joseph
Create a Home Valuation Report for This Property
The Home Valuation Report is an in-depth analysis detailing your home's value as well as a comparison with similar homes in the area
Home Values in the Area
Average Home Value in this Area
Purchase History
| Date | Buyer | Sale Price | Title Company |
|---|---|---|---|
| Joseph & Linda Afonso Ret | -- | None Available | |
| Afonso Joseph | $45,000 | None Available | |
| Gemski Stephanie M | -- | -- | |
| Gemski Stephanie M | -- | -- | |
| Afonso Joseph | $41,000 | -- | |
| Gemski Christopher K | -- | -- |
Source: Public Records
Tax History Compared to Growth
Tax History
| Year | Tax Paid | Tax Assessment Tax Assessment Total Assessment is a certain percentage of the fair market value that is determined by local assessors to be the total taxable value of land and additions on the property. | Land | Improvement |
|---|---|---|---|---|
| 2025 | $5,563 | $453,400 | $87,700 | $365,700 |
| 2024 | $5,418 | $453,400 | $87,700 | $365,700 |
| 2023 | $5,269 | $453,400 | $87,700 | $365,700 |
| 2022 | $3,929 | $262,100 | $64,300 | $197,800 |
| 2021 | $3,863 | $262,100 | $64,300 | $197,800 |
| 2020 | $3,753 | $262,100 | $64,300 | $197,800 |
| 2019 | $3,783 | $238,200 | $55,500 | $182,700 |
| 2018 | $855 | $238,200 | $55,500 | $182,700 |
| 2017 | $3,623 | $238,200 | $55,500 | $182,700 |
| 2016 | $3,365 | $197,000 | $57,300 | $139,700 |
| 2015 | $3,365 | $197,000 | $57,300 | $139,700 |
| 2014 | $3,365 | $197,000 | $57,300 | $139,700 |
| 2013 | $3,257 | $206,400 | $58,400 | $148,000 |
Source: Public Records
Map
Nearby Homes