80 Doc Sherrod Rd Coolidge, GA 31738
Estimated Value: $283,000 - $360,000
--
Bed
1
Bath
2,191
Sq Ft
$142/Sq Ft
Est. Value
About This Home
This home is located at 80 Doc Sherrod Rd, Coolidge, GA 31738 and is currently estimated at $312,211, approximately $142 per square foot. 80 Doc Sherrod Rd is a home located in Thomas County with nearby schools including Hand in Hand Primary School, Cross Creek Elementary School, and Garrison-Pilcher Elementary School.
Ownership History
Date
Name
Owned For
Owner Type
Purchase Details
Closed on
Feb 26, 2024
Sold by
Richardson William E
Bought by
Richardson Michelle Brock and Richardson William E
Current Estimated Value
Home Financials for this Owner
Home Financials are based on the most recent Mortgage that was taken out on this home.
Original Mortgage
$155,900
Outstanding Balance
$144,619
Interest Rate
5.96%
Mortgage Type
New Conventional
Estimated Equity
$167,592
Purchase Details
Closed on
Apr 17, 2021
Sold by
Roberts Justin R
Bought by
Willoughby Earl G and Willoughby Alicia M
Purchase Details
Closed on
Oct 30, 2018
Sold by
Carlton Marjorie S
Bought by
Roberts Justin R
Home Financials for this Owner
Home Financials are based on the most recent Mortgage that was taken out on this home.
Original Mortgage
$159,747
Interest Rate
4.75%
Mortgage Type
FHA
Purchase Details
Closed on
Oct 31, 1982
Bought by
Carlton Marjorie S
Create a Home Valuation Report for This Property
The Home Valuation Report is an in-depth analysis detailing your home's value as well as a comparison with similar homes in the area
Home Values in the Area
Average Home Value in this Area
Purchase History
| Date | Buyer | Sale Price | Title Company |
|---|---|---|---|
| Richardson Michelle Brock | -- | -- | |
| Richardson William E | $299,900 | -- | |
| Willoughby Earl G | $263,000 | -- | |
| Roberts Justin R | $167,000 | -- | |
| Carlton Marjorie S | -- | -- |
Source: Public Records
Mortgage History
| Date | Status | Borrower | Loan Amount |
|---|---|---|---|
| Open | Richardson William E | $155,900 | |
| Previous Owner | Roberts Justin R | $159,747 |
Source: Public Records
Tax History Compared to Growth
Tax History
| Year | Tax Paid | Tax Assessment Tax Assessment Total Assessment is a certain percentage of the fair market value that is determined by local assessors to be the total taxable value of land and additions on the property. | Land | Improvement |
|---|---|---|---|---|
| 2024 | $1,954 | $94,680 | $10,626 | $84,054 |
| 2023 | $1,404 | $69,684 | $8,501 | $61,183 |
| 2022 | $1,379 | $61,999 | $8,501 | $53,498 |
| 2021 | $1,283 | $52,410 | $7,392 | $45,018 |
| 2020 | $1,285 | $51,174 | $7,392 | $43,782 |
| 2019 | $1,299 | $51,174 | $7,392 | $43,782 |
| 2018 | $1,248 | $49,859 | $7,392 | $42,467 |
| 2017 | $1,269 | $49,927 | $7,392 | $42,535 |
| 2016 | $1,255 | $49,044 | $7,392 | $41,652 |
| 2015 | $1,322 | $50,786 | $7,392 | $43,394 |
| 2014 | $1,301 | $49,815 | $7,392 | $42,423 |
| 2013 | -- | $49,815 | $7,392 | $42,423 |
Source: Public Records
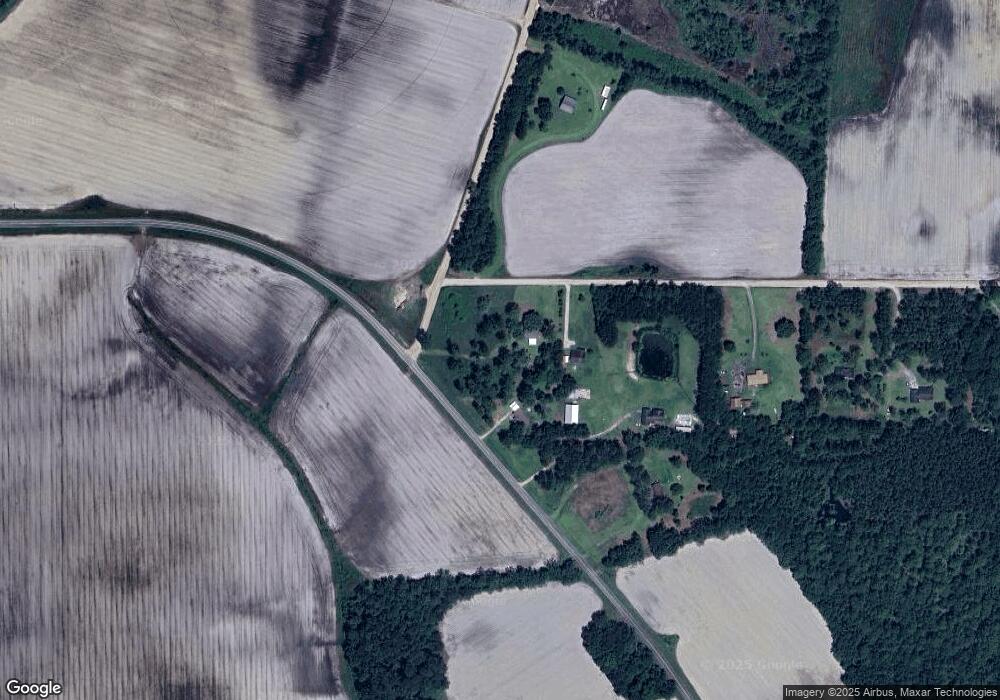
Map
Nearby Homes
- 100 Morgan Place
- 102 Morgan Place
- 110 Morgan Place
- 112 Morgan Place
- 258
- 4016 E Japonica Ave
- 0000 N
- 21688 U S 319
- 21688 US Highway 319 N
- 2069 Baker Rd
- 16343 Ga Hwy 33 - 8 34 Acres Hwy
- 16343 Georgia 33
- 16343 Ga Hwy 33 -8 34 Acres
- 16343
- 3812 Ponder Rd
- 13876 Ga Highway 122
- 1230 Parrish Rd
- 813 Vonier Road (6 Acres)
- 110 Nicole Britt Dr
- 203 Bailey Cir
- 80 Doc Sherrod Rd
- 100 Doc Sherrod Rd
- 5534 Patten Coolidge Rd
- 5520 Patten-Coolidge Rd Unit 1
- 194 Doc Sherrod Rd
- 59 Doc Sherrod Rd
- 228 Doc Sherrod Rd
- 288 Doc Sherrod Rd
- 256 Doc Sherrod Rd
- 5302 Patten-Coolidge Rd
- 344 Doc Sherrod Rd
- 460 Doc Sherrod Rd
- 768 Parramore Rd
- 800 Parramore Rd
- 842 Parramore Rd
- 888 Parramore Rd
- 1765 Murphy Rd
- 1755 Murphy Rd
- 5015 Enon Rd
- 1106 Parramore Rd