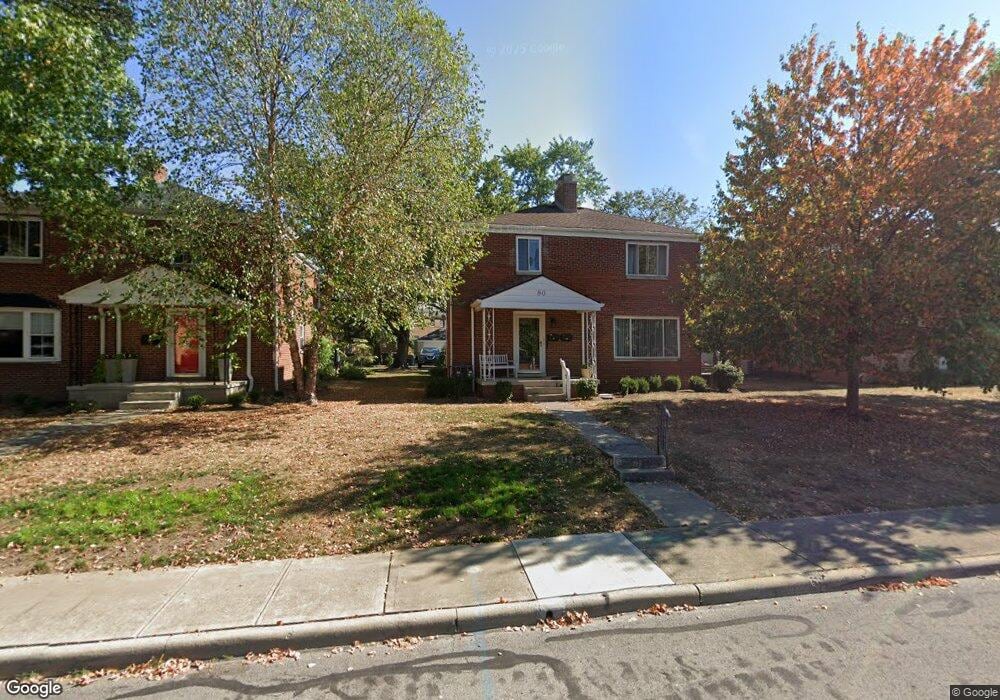
80 E Henderson Rd Columbus, OH 43214
Clintonville NeighborhoodEstimated Value: $445,000 - $498,000
4
Beds
2
Baths
2,412
Sq Ft
$197/Sq Ft
Est. Value
About This Home
This home is located at 80 E Henderson Rd, Columbus, OH 43214 and is currently estimated at $474,112, approximately $196 per square foot. 80 E Henderson Rd is a home located in Franklin County with nearby schools including Indian Springs Elementary School, Dominion Middle School, and Whetstone High School.
Ownership History
Date
Name
Owned For
Owner Type
Purchase Details
Closed on
Oct 30, 2025
Sold by
Weisent Family Trust and Scholl Joy W
Bought by
Weisent Judy K
Current Estimated Value
Purchase Details
Closed on
Oct 1, 2011
Sold by
Weisent Charles O and Weisent Janet W
Bought by
Scholl Joy Wq and The Weisent Family Trust
Purchase Details
Closed on
Mar 11, 2011
Sold by
Rankey Jeffrey M and Rankey David C
Bought by
Weisant Charles O
Purchase Details
Closed on
Jan 3, 2008
Sold by
Dibert James D and Dibert Karen J
Bought by
Rankey Jeffrey M and Rankey David C
Home Financials for this Owner
Home Financials are based on the most recent Mortgage that was taken out on this home.
Original Mortgage
$209,216
Interest Rate
6.27%
Mortgage Type
FHA
Purchase Details
Closed on
Nov 21, 2001
Sold by
Durst John C
Bought by
Dibert James D and Dibert Karen J
Purchase Details
Closed on
Jan 12, 1987
Bought by
Durst John C
Create a Home Valuation Report for This Property
The Home Valuation Report is an in-depth analysis detailing your home's value as well as a comparison with similar homes in the area
Home Values in the Area
Average Home Value in this Area
Purchase History
| Date | Buyer | Sale Price | Title Company |
|---|---|---|---|
| Weisent Judy K | -- | None Listed On Document | |
| Scholl Joy Wq | -- | Attorney | |
| Weisant Charles O | $212,000 | Service Tit | |
| Rankey Jeffrey M | $212,500 | Talon Gro | |
| Dibert James D | $161,100 | -- | |
| Durst John C | $84,000 | -- |
Source: Public Records
Mortgage History
| Date | Status | Borrower | Loan Amount |
|---|---|---|---|
| Previous Owner | Rankey Jeffrey M | $209,216 |
Source: Public Records
Tax History
| Year | Tax Paid | Tax Assessment Tax Assessment Total Assessment is a certain percentage of the fair market value that is determined by local assessors to be the total taxable value of land and additions on the property. | Land | Improvement |
|---|---|---|---|---|
| 2025 | $5,976 | $130,410 | $29,260 | $101,150 |
| 2024 | $5,976 | $130,410 | $29,260 | $101,150 |
| 2023 | $6,052 | $130,410 | $29,260 | $101,150 |
| 2022 | $5,340 | $100,490 | $24,400 | $76,090 |
| 2021 | $5,350 | $100,490 | $24,400 | $76,090 |
| 2020 | $5,358 | $100,490 | $24,400 | $76,090 |
| 2019 | $4,805 | $77,280 | $18,760 | $58,520 |
| 2018 | $4,927 | $77,280 | $18,760 | $58,520 |
| 2017 | $5,152 | $77,280 | $18,760 | $58,520 |
| 2016 | $5,500 | $80,960 | $16,560 | $64,400 |
| 2015 | $5,058 | $80,960 | $16,560 | $64,400 |
| 2014 | $5,020 | $80,960 | $16,560 | $64,400 |
| 2013 | $2,357 | $77,070 | $15,750 | $61,320 |
Source: Public Records
Map
Nearby Homes
- 151 W Dominion Blvd
- 243 E Schreyer Place
- 142 W Schreyer Place
- 82 Blenheim Rd
- 390 Lenappe Dr
- 4466 Olentangy Blvd
- 325 Starrett Ct
- 144 Wetmore Rd
- 188 Chatham Rd
- 435 E Beaumont Rd
- 389 Wetmore Rd
- 103 E Jeffrey Place
- 126 Erie Rd
- 374 Acton Rd
- 62 W Rathbone Ave
- 122 W Rathbone Ave
- 522 E Beechwold Blvd
- 4753 Olentangy River Rd Unit ''B''
- 30 E Torrence Rd
- 655 Providence Ave Unit B
- 76 E Henderson Rd
- 84 E Henderson Rd Unit 86
- 70 E Henderson Rd
- 93 Village Dr
- 85 E Henderson Rd Unit 87
- 105 Village Dr
- 75 E Henderson Rd Unit C
- 75 E Henderson Rd Unit D
- 75 E Henderson Rd Unit A
- 75 E Henderson Rd Unit B
- 75 E Henderson Rd
- 75 E Henderson Rd Unit 75A
- 75 E Henderson Rd Unit 75a
- 121 Fairlawn Dr Unit 123
- 65 E Henderson Rd
- 80 E Cooke Rd
- 116 E Henderson Rd
- 74 E Cooke Rd Unit 76
- 125 Fairlawn Dr Unit 127
- 55 E Henderson Rd
Your Personal Tour Guide
Ask me questions while you tour the home.