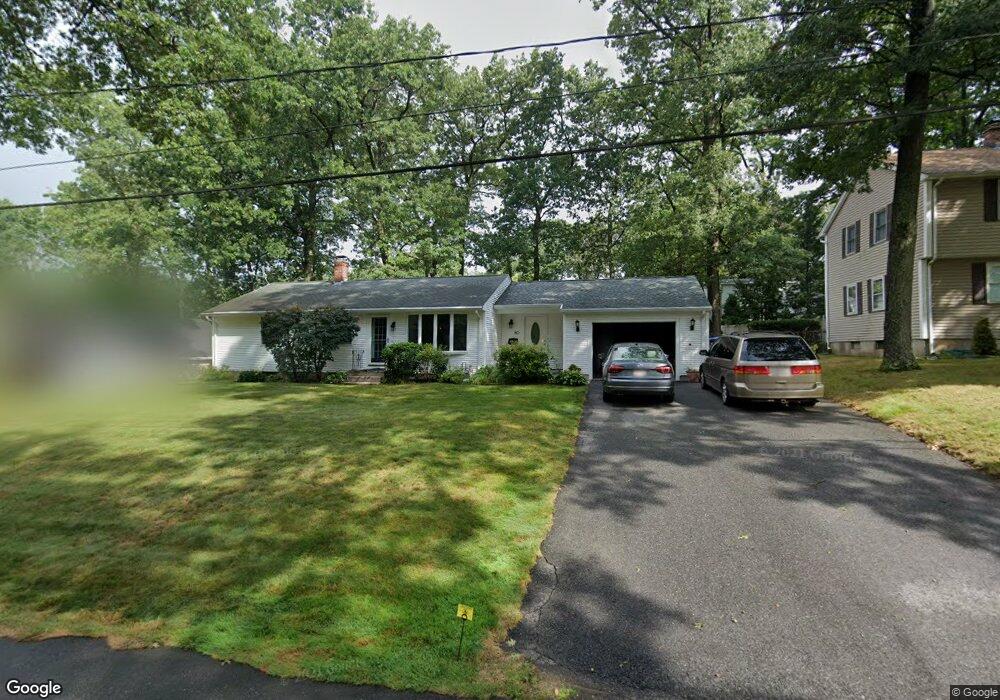
80 Endicott St Springfield, MA 01118
East Forest Park NeighborhoodEstimated Value: $323,000 - $356,000
3
Beds
1
Bath
1,448
Sq Ft
$237/Sq Ft
Est. Value
About This Home
This home is located at 80 Endicott St, Springfield, MA 01118 and is currently estimated at $342,752, approximately $236 per square foot. 80 Endicott St is a home located in Hampden County with nearby schools including Frederick Harris Elementary School, M Marcus Kiley Middle, and Springfield High School of Science and Technology.
Ownership History
Date
Name
Owned For
Owner Type
Purchase Details
Closed on
Jan 21, 2025
Sold by
Frijia Giovanni and Frijia Irene
Bought by
Frijia Income-Only Ft and Frijia
Current Estimated Value
Purchase Details
Closed on
Jun 21, 1996
Sold by
Est Ahrens Christina W and Granfield Coralie A
Bought by
Frijia Giovanni and Giovanni Irene
Home Financials for this Owner
Home Financials are based on the most recent Mortgage that was taken out on this home.
Original Mortgage
$65,000
Interest Rate
8.21%
Mortgage Type
Purchase Money Mortgage
Create a Home Valuation Report for This Property
The Home Valuation Report is an in-depth analysis detailing your home's value as well as a comparison with similar homes in the area
Home Values in the Area
Average Home Value in this Area
Purchase History
| Date | Buyer | Sale Price | Title Company |
|---|---|---|---|
| Frijia Income-Only Ft | -- | None Available | |
| Frijia Income-Only Ft | -- | None Available | |
| Frijia Giovanni | $75,000 | -- | |
| Frijia Giovanni | $75,000 | -- |
Source: Public Records
Mortgage History
| Date | Status | Borrower | Loan Amount |
|---|---|---|---|
| Previous Owner | Frijia Giovanni | $65,000 |
Source: Public Records
Tax History
| Year | Tax Paid | Tax Assessment Tax Assessment Total Assessment is a certain percentage of the fair market value that is determined by local assessors to be the total taxable value of land and additions on the property. | Land | Improvement |
|---|---|---|---|---|
| 2025 | $5,639 | $359,600 | $48,300 | $311,300 |
| 2024 | $6,082 | $378,700 | $48,300 | $330,400 |
| 2023 | $5,529 | $324,300 | $46,000 | $278,300 |
| 2022 | $4,760 | $252,900 | $46,000 | $206,900 |
| 2021 | $4,772 | $252,500 | $41,800 | $210,700 |
| 2020 | $4,509 | $230,900 | $41,800 | $189,100 |
| 2019 | $4,025 | $204,500 | $41,800 | $162,700 |
| 2018 | $4,038 | $205,200 | $41,800 | $163,400 |
| 2017 | $3,798 | $193,200 | $41,800 | $151,400 |
| 2016 | $3,686 | $187,500 | $41,800 | $145,700 |
| 2015 | $3,602 | $183,100 | $41,800 | $141,300 |
Source: Public Records
Map
Nearby Homes
- 46 Hadley St
- 206 Treetop Ave
- 125 Manor Ct Unit 125
- 116 Carr St
- 119 Powell Ave
- 19 Manor Ct Unit 19
- 17 Pebble Mill Rd
- 49 Corcoran Blvd
- 55 Allen St
- 13 Bither St
- 47 Hartford Terrace
- 1088 Sumner Ave
- 65 Helen Cir
- 48 Fairview St
- 161 Dorset St
- 78 Wood Ave
- 26 Dwight Rd
- 86 Talmadge Dr
- 29 Eddywood St
- 79 Roosevelt Ave
Your Personal Tour Guide
Ask me questions while you tour the home.