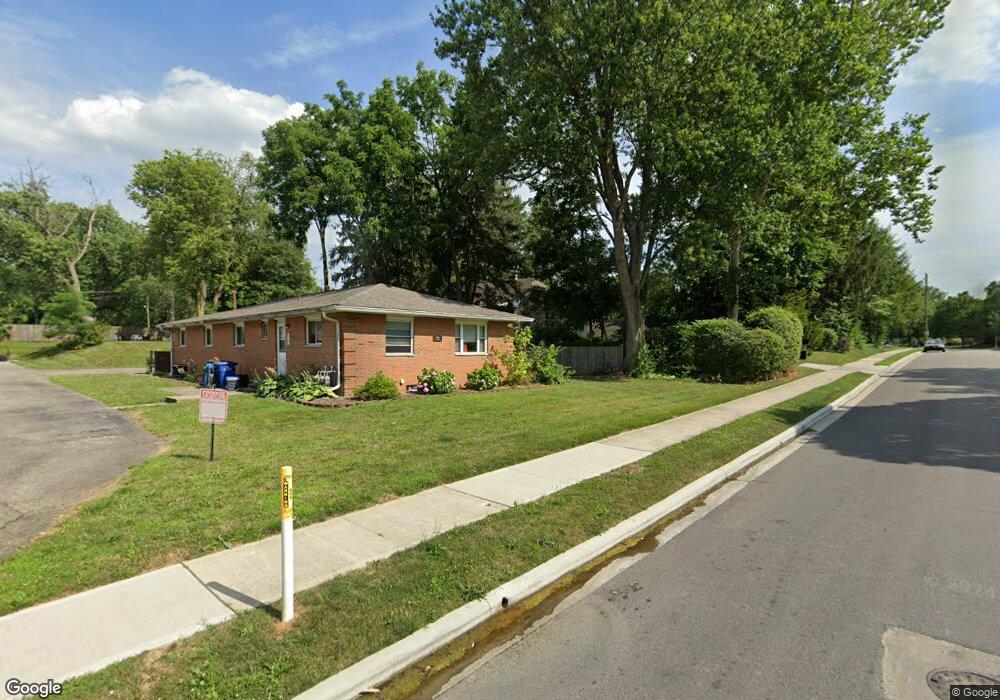
80 Flint Ridge Dr Columbus, OH 43230
Gahanna-Havens Corners NeighborhoodEstimated Value: $331,000 - $400,000
3
Beds
2
Baths
1,542
Sq Ft
$234/Sq Ft
Est. Value
About This Home
This home is located at 80 Flint Ridge Dr, Columbus, OH 43230 and is currently estimated at $361,538, approximately $234 per square foot. 80 Flint Ridge Dr is a home located in Franklin County with nearby schools including Goshen Lane Elementary School, Gahanna East Middle School, and Lincoln High School.
Ownership History
Date
Name
Owned For
Owner Type
Purchase Details
Closed on
Jun 25, 2008
Sold by
Keelen Robert J and Keelen Sally Frances
Bought by
Keelen Robert J and Keelen Sally Frances
Current Estimated Value
Purchase Details
Closed on
Apr 2, 2003
Sold by
Janis Martin A and Janis Roxanne L
Bought by
Keelen Robert J and Keelen Sally F
Home Financials for this Owner
Home Financials are based on the most recent Mortgage that was taken out on this home.
Original Mortgage
$117,900
Interest Rate
5.09%
Mortgage Type
Purchase Money Mortgage
Purchase Details
Closed on
Jul 26, 1996
Sold by
Randolph George C and Randolph Helen S
Bought by
Flessel Roxanne L and Flessel Janis Martin
Home Financials for this Owner
Home Financials are based on the most recent Mortgage that was taken out on this home.
Original Mortgage
$105,317
Interest Rate
8.05%
Mortgage Type
FHA
Purchase Details
Closed on
Oct 13, 1988
Purchase Details
Closed on
May 1, 1986
Create a Home Valuation Report for This Property
The Home Valuation Report is an in-depth analysis detailing your home's value as well as a comparison with similar homes in the area
Home Values in the Area
Average Home Value in this Area
Purchase History
| Date | Buyer | Sale Price | Title Company |
|---|---|---|---|
| Keelen Robert J | -- | None Available | |
| Keelen Robert J | $131,000 | Real Living Title | |
| Flessel Roxanne L | $106,000 | Connor Title Co | |
| -- | $87,000 | -- | |
| -- | $69,900 | -- |
Source: Public Records
Mortgage History
| Date | Status | Borrower | Loan Amount |
|---|---|---|---|
| Closed | Keelen Robert J | $117,900 | |
| Closed | Flessel Roxanne L | $105,317 |
Source: Public Records
Tax History Compared to Growth
Tax History
| Year | Tax Paid | Tax Assessment Tax Assessment Total Assessment is a certain percentage of the fair market value that is determined by local assessors to be the total taxable value of land and additions on the property. | Land | Improvement |
|---|---|---|---|---|
| 2024 | $6,926 | $117,570 | $29,540 | $88,030 |
| 2023 | $6,839 | $117,565 | $29,540 | $88,025 |
| 2022 | $6,210 | $83,160 | $14,070 | $69,090 |
| 2021 | $6,006 | $83,160 | $14,070 | $69,090 |
| 2020 | $5,956 | $83,160 | $14,070 | $69,090 |
| 2019 | $4,985 | $69,450 | $11,730 | $57,720 |
| 2018 | $4,250 | $69,450 | $11,730 | $57,720 |
| 2017 | $4,062 | $69,450 | $11,730 | $57,720 |
| 2016 | $3,549 | $49,070 | $12,320 | $36,750 |
| 2015 | $3,552 | $49,070 | $12,320 | $36,750 |
| 2014 | $3,525 | $49,070 | $12,320 | $36,750 |
| 2013 | $1,729 | $48,475 | $11,725 | $36,750 |
Source: Public Records
Map
Nearby Homes
- 183 Serran Dr
- 198 Gary Lee Dr
- 219 N Hamilton Rd
- 206 Lintner St
- 379 Heil Dr
- 311 N Hamilton Rd
- 603 Fawndale Place
- 373 Lyncroft Dr
- 745 Fleetrun Ave
- 305 Caro Ln
- 209 Springbrook Place
- 714 Schyler Ct
- 317 Sycamore Ridge Way Unit 317
- 497 Uxbridge Ave
- 610 Chadwood Dr
- 657 Picadilly Ct
- 390 Dunbarton Rd
- 404 Foxwood Dr
- 174 Grand Ridge Ct
- 407 Denison Ave
- 84 Flint Ridge Dr
- 72 -74 Flint Ridge Dr
- 72 -74 Flint Ridge Dr Unit 72 Flint Ridge
- 72 Flint Ridge Dr Unit 74
- 94 Flint Ridge Dr
- 85 Jahn Ct
- 329 Granville St Unit 331
- 333 Granville St Unit 335
- 325 Granville St Unit 327
- 102 Flint Ridge Dr
- 77 Flint Ridge Dr
- 89 Jahn Ct
- 85 Flint Ridge Dr
- 79 Jahn Dr
- 79 Jahn Ct
- 309 Granville St Unit 311
- 93 Flint Ridge Dr
- 108 Flint Ridge Dr
- 105 Flint Ridge Dr
- 303 Granville St Unit 305