Estimated Value: $1,588,774 - $3,013,000
4
Beds
4
Baths
4,553
Sq Ft
$458/Sq Ft
Est. Value
About This Home
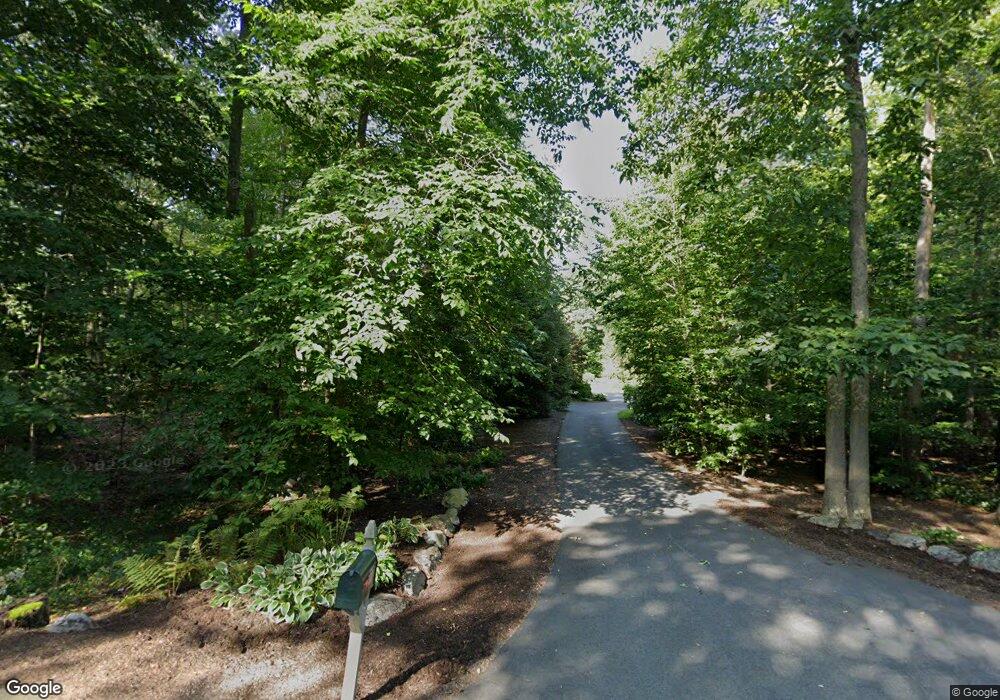
This home is located at 80 Glen St, Dover, MA 02030 and is currently estimated at $2,086,444, approximately $458 per square foot. 80 Glen St is a home with nearby schools including Chickering Elementary School, Dover-Sherborn Regional Middle School, and Dover-Sherborn Regional High School.
Ownership History
Date
Name
Owned For
Owner Type
Purchase Details
Closed on
Sep 25, 1998
Sold by
Glen St T
Bought by
Hamlin David E and Hamlin Rebecca M
Current Estimated Value
Home Financials for this Owner
Home Financials are based on the most recent Mortgage that was taken out on this home.
Original Mortgage
$639,200
Interest Rate
6.87%
Mortgage Type
Purchase Money Mortgage
Create a Home Valuation Report for This Property
The Home Valuation Report is an in-depth analysis detailing your home's value as well as a comparison with similar homes in the area
Home Values in the Area
Average Home Value in this Area
Purchase History
| Date | Buyer | Sale Price | Title Company |
|---|---|---|---|
| Hamlin David E | $799,900 | -- |
Source: Public Records
Mortgage History
| Date | Status | Borrower | Loan Amount |
|---|---|---|---|
| Open | Hamlin David E | $639,000 | |
| Closed | Hamlin David E | $639,200 |
Source: Public Records
Tax History
| Year | Tax Paid | Tax Assessment Tax Assessment Total Assessment is a certain percentage of the fair market value that is determined by local assessors to be the total taxable value of land and additions on the property. | Land | Improvement |
|---|---|---|---|---|
| 2025 | $14,392 | $1,277,000 | $434,200 | $842,800 |
| 2024 | $13,252 | $1,209,100 | $419,500 | $789,600 |
| 2023 | $12,879 | $1,056,500 | $368,000 | $688,500 |
| 2022 | $11,938 | $961,200 | $353,300 | $607,900 |
| 2021 | $12,113 | $939,700 | $353,300 | $586,400 |
| 2020 | $12,017 | $935,900 | $353,300 | $582,600 |
| 2019 | $11,883 | $919,000 | $353,300 | $565,700 |
| 2018 | $11,344 | $883,500 | $353,300 | $530,200 |
| 2017 | $11,357 | $870,300 | $323,800 | $546,500 |
| 2016 | $11,902 | $924,100 | $336,500 | $587,600 |
| 2015 | $12,615 | $993,300 | $399,500 | $593,800 |
Source: Public Records
Map
Nearby Homes