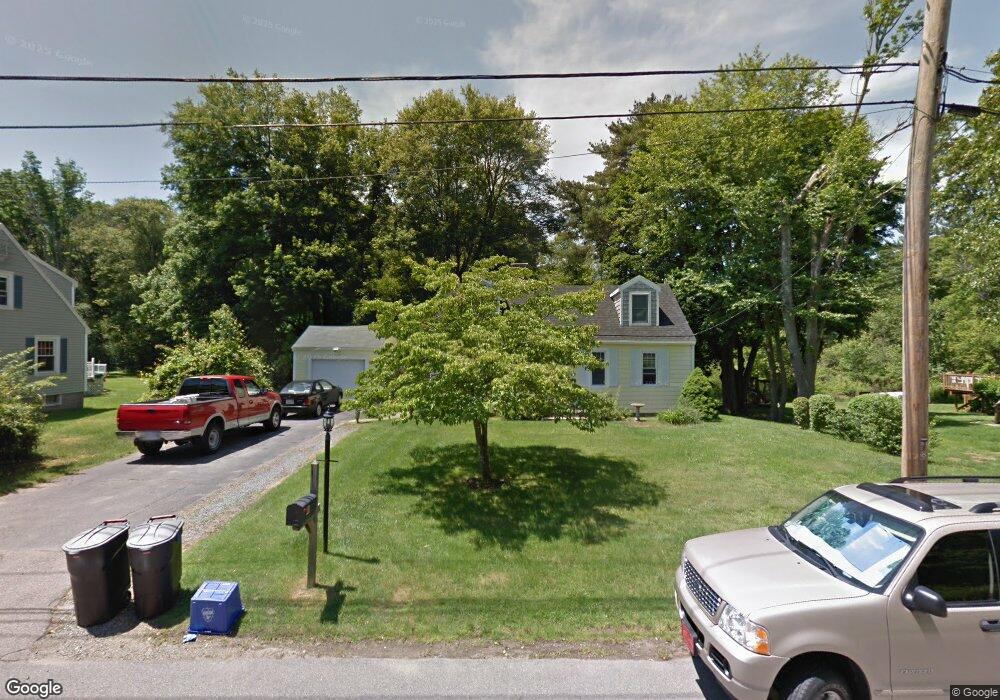
80 Greenwood St Rockland, MA 02370
Estimated Value: $502,000 - $562,000
4
Beds
1
Bath
1,512
Sq Ft
$356/Sq Ft
Est. Value
About This Home
This home is located at 80 Greenwood St, Rockland, MA 02370 and is currently estimated at $538,907, approximately $356 per square foot. 80 Greenwood St is a home located in Plymouth County with nearby schools including Rockland Senior High School, Calvary Chapel Academy, and Holy Family Elementary School.
Ownership History
Date
Name
Owned For
Owner Type
Purchase Details
Closed on
May 28, 2010
Sold by
Daigle Paul R
Bought by
Powers Robert W and Powers Julie L
Current Estimated Value
Home Financials for this Owner
Home Financials are based on the most recent Mortgage that was taken out on this home.
Original Mortgage
$251,611
Outstanding Balance
$166,800
Interest Rate
4.75%
Mortgage Type
FHA
Estimated Equity
$372,107
Purchase Details
Closed on
Jun 24, 2004
Sold by
Cristoforo Paul and Cristoforo Karen L
Bought by
Daigle Paul R
Home Financials for this Owner
Home Financials are based on the most recent Mortgage that was taken out on this home.
Original Mortgage
$190,000
Interest Rate
6.32%
Mortgage Type
Purchase Money Mortgage
Purchase Details
Closed on
Aug 12, 1992
Sold by
Kasmouski Geraldine K
Bought by
South Shore Bk
Create a Home Valuation Report for This Property
The Home Valuation Report is an in-depth analysis detailing your home's value as well as a comparison with similar homes in the area
Home Values in the Area
Average Home Value in this Area
Purchase History
| Date | Buyer | Sale Price | Title Company |
|---|---|---|---|
| Powers Robert W | $255,000 | -- | |
| Daigle Paul R | $300,000 | -- | |
| South Shore Bk | $60,000 | -- |
Source: Public Records
Mortgage History
| Date | Status | Borrower | Loan Amount |
|---|---|---|---|
| Open | Powers Robert W | $251,611 | |
| Previous Owner | South Shore Bk | $190,000 | |
| Previous Owner | South Shore Bk | $231,000 |
Source: Public Records
Tax History Compared to Growth
Tax History
| Year | Tax Paid | Tax Assessment Tax Assessment Total Assessment is a certain percentage of the fair market value that is determined by local assessors to be the total taxable value of land and additions on the property. | Land | Improvement |
|---|---|---|---|---|
| 2025 | $6,335 | $463,400 | $236,800 | $226,600 |
| 2024 | $6,148 | $437,300 | $223,400 | $213,900 |
| 2023 | $6,111 | $401,500 | $204,900 | $196,600 |
| 2022 | $5,856 | $349,600 | $178,200 | $171,400 |
| 2021 | $8,341 | $318,600 | $162,000 | $156,600 |
| 2020 | $5,315 | $303,700 | $154,300 | $149,400 |
| 2019 | $9,811 | $289,600 | $146,900 | $142,700 |
| 2018 | $4,945 | $271,400 | $146,900 | $124,500 |
| 2017 | $5,746 | $260,600 | $146,900 | $113,700 |
| 2016 | $4,637 | $250,800 | $141,300 | $109,500 |
| 2015 | $4,415 | $232,000 | $132,100 | $99,900 |
| 2014 | $4,172 | $227,500 | $129,500 | $98,000 |
Source: Public Records
Map
Nearby Homes
- 94 Leisurewoods Dr
- 11 Hawthorne St
- 35-37 Salem St
- 86 Leisurewoods Dr Unit 279
- 10 Horn Beam St Unit 299
- 3 Hickory Cir
- 5 Juniper Cir
- 9 Juniper Cir
- 775 Union St
- 737-739 Union St
- 27 Fir Rd
- 40 Fir Rd Unit 386
- 12 Dyer St Unit 12
- 14 Dyer St Unit 14
- 83 Summit St
- 11 Dyer St Unit 11
- 13 Dyer St Unit 13
- 7 Boxberry Ln Unit 7
- 1 Canterbury Ln
- 20 Birch St
- 78 Greenwood St
- 90 Greenwood St
- 75 Greenwood St
- 68 Greenwood St
- 102 Greenwood St
- 85 Greenwood St
- 65 Greenwood St
- 58 Greenwood St
- 106 Greenwood St
- 111 Greenwood St
- 48 Greenwood St
- 112 Greenwood St
- 51 Greenwood St
- 42 Greenwood St
- 36 Greenwood St
- 129 Greenwood St
- 128 Greenwood St
- 38 Greenwood St
- 37 Greenwood St
- 139 Greenwood St