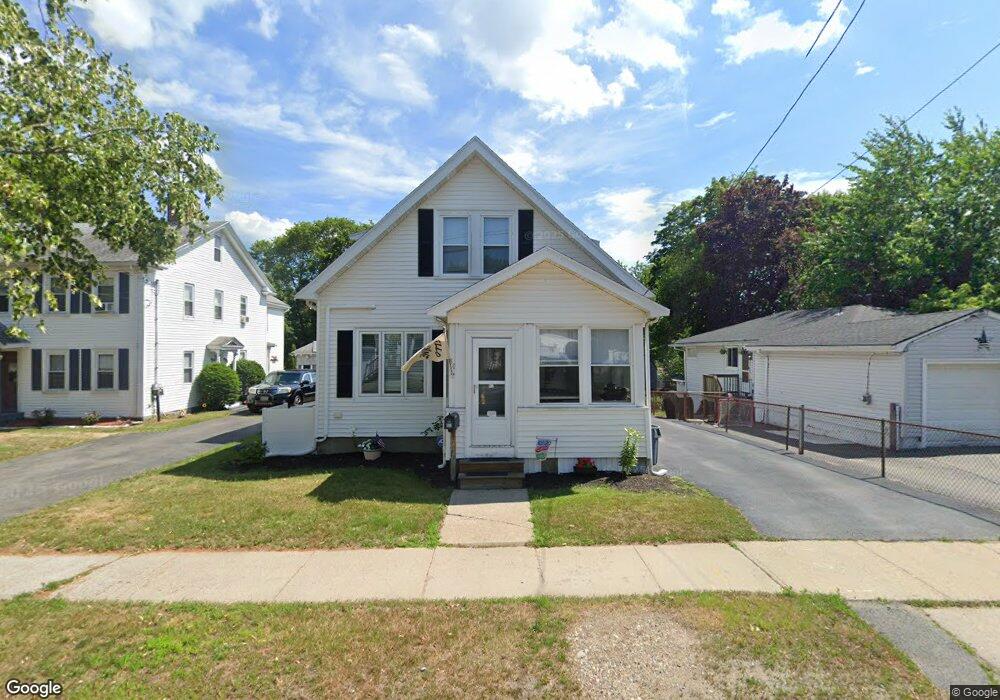
80 Main St Saugus, MA 01906
Downtown Saugus NeighborhoodEstimated Value: $498,000 - $627,608
4
Beds
2
Baths
1,302
Sq Ft
$439/Sq Ft
Est. Value
About This Home
This home is located at 80 Main St, Saugus, MA 01906 and is currently estimated at $571,902, approximately $439 per square foot. 80 Main St is a home located in Essex County with nearby schools including Saugus High School, Pioneer Charter School Of Science II, and Sacred Heart School.
Ownership History
Date
Name
Owned For
Owner Type
Purchase Details
Closed on
Jul 7, 2020
Sold by
White Cathy A
Bought by
White Rt
Current Estimated Value
Purchase Details
Closed on
Jul 31, 2018
Sold by
White Catherine D Est
Bought by
White Cathy A
Home Financials for this Owner
Home Financials are based on the most recent Mortgage that was taken out on this home.
Original Mortgage
$220,000
Interest Rate
4.6%
Mortgage Type
New Conventional
Create a Home Valuation Report for This Property
The Home Valuation Report is an in-depth analysis detailing your home's value as well as a comparison with similar homes in the area
Home Values in the Area
Average Home Value in this Area
Purchase History
| Date | Buyer | Sale Price | Title Company |
|---|---|---|---|
| White Rt | -- | None Available | |
| White Cathy A | $288,000 | -- |
Source: Public Records
Mortgage History
| Date | Status | Borrower | Loan Amount |
|---|---|---|---|
| Previous Owner | White Cathy A | $220,000 |
Source: Public Records
Tax History
| Year | Tax Paid | Tax Assessment Tax Assessment Total Assessment is a certain percentage of the fair market value that is determined by local assessors to be the total taxable value of land and additions on the property. | Land | Improvement |
|---|---|---|---|---|
| 2025 | $6,069 | $568,300 | $293,400 | $274,900 |
| 2024 | $5,706 | $535,800 | $266,700 | $269,100 |
| 2023 | $5,632 | $500,200 | $240,100 | $260,100 |
| 2022 | $5,328 | $443,600 | $219,600 | $224,000 |
| 2021 | $4,934 | $399,800 | $191,200 | $208,600 |
| 2020 | $4,564 | $382,900 | $182,300 | $200,600 |
| 2019 | $4,016 | $329,700 | $164,500 | $165,200 |
| 2018 | $3,582 | $309,300 | $160,000 | $149,300 |
| 2017 | $3,339 | $277,100 | $149,400 | $127,700 |
| 2016 | $2,863 | $234,700 | $142,100 | $92,600 |
| 2015 | $2,688 | $223,600 | $135,400 | $88,200 |
| 2014 | $2,661 | $229,200 | $135,400 | $93,800 |
Source: Public Records
Map
Nearby Homes
Your Personal Tour Guide
Ask me questions while you tour the home.