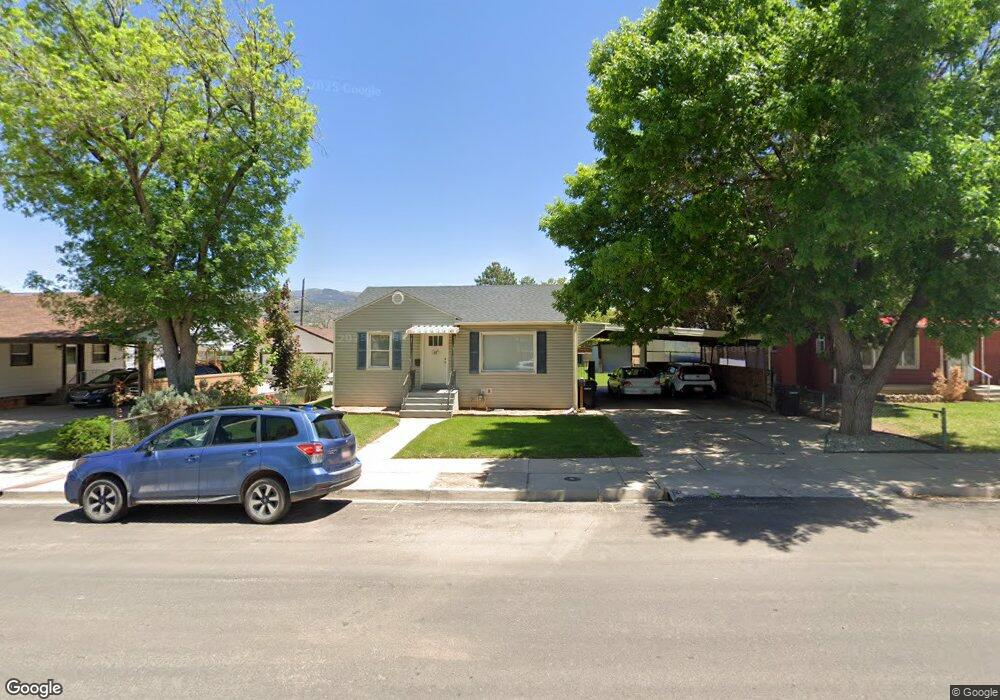
80 N 800 W Cedar City, UT 84720
Estimated Value: $305,613 - $365,000
--
Bed
--
Bath
835
Sq Ft
$399/Sq Ft
Est. Value
About This Home
This home is located at 80 N 800 W, Cedar City, UT 84720 and is currently estimated at $333,153, approximately $398 per square foot. 80 N 800 W is a home with nearby schools including Cedar North School, Cedar Middle School, and Cedar City High School.
Ownership History
Date
Name
Owned For
Owner Type
Purchase Details
Closed on
May 8, 2017
Sold by
Brown Craig W and Brown Erika
Bought by
Ashdown Mckay Philips
Current Estimated Value
Home Financials for this Owner
Home Financials are based on the most recent Mortgage that was taken out on this home.
Original Mortgage
$118,000
Outstanding Balance
$98,479
Interest Rate
4.23%
Mortgage Type
New Conventional
Estimated Equity
$234,674
Purchase Details
Closed on
May 5, 2017
Sold by
Ashdown Mckay Phillips
Bought by
Ashdown Mckay Phillips and Ashdown Autumn Louise
Home Financials for this Owner
Home Financials are based on the most recent Mortgage that was taken out on this home.
Original Mortgage
$118,000
Outstanding Balance
$98,479
Interest Rate
4.23%
Mortgage Type
New Conventional
Estimated Equity
$234,674
Purchase Details
Closed on
Mar 5, 2007
Sold by
Jorgensen C Kay and Jorgensen Laree
Bought by
Jorgensen C K and Jorgensen Laree
Create a Home Valuation Report for This Property
The Home Valuation Report is an in-depth analysis detailing your home's value as well as a comparison with similar homes in the area
Home Values in the Area
Average Home Value in this Area
Purchase History
| Date | Buyer | Sale Price | Title Company |
|---|---|---|---|
| Ashdown Mckay Philips | -- | None Available | |
| Ashdown Mckay Phillips | -- | Security Escrow & Title Isnu | |
| Jorgensen C K | -- | -- |
Source: Public Records
Mortgage History
| Date | Status | Borrower | Loan Amount |
|---|---|---|---|
| Open | Ashdown Mckay Philips | $118,000 | |
| Closed | Ashdown Mckay Phillips | $118,000 |
Source: Public Records
Tax History Compared to Growth
Tax History
| Year | Tax Paid | Tax Assessment Tax Assessment Total Assessment is a certain percentage of the fair market value that is determined by local assessors to be the total taxable value of land and additions on the property. | Land | Improvement |
|---|---|---|---|---|
| 2025 | $1,159 | $149,028 | $41,545 | $107,483 |
| 2023 | $1,121 | $148,630 | $34,620 | $114,010 |
| 2022 | $1,366 | $148,630 | $34,620 | $114,010 |
| 2021 | $958 | $104,205 | $16,485 | $87,720 |
| 2020 | $924 | $89,125 | $16,485 | $72,640 |
| 2019 | $895 | $82,555 | $16,485 | $66,070 |
| 2018 | $925 | $82,555 | $16,485 | $66,070 |
| 2017 | $804 | $70,640 | $14,495 | $56,145 |
| 2016 | $741 | $60,615 | $13,810 | $46,805 |
| 2015 | $736 | $57,085 | $0 | $0 |
| 2014 | $661 | $47,945 | $0 | $0 |
Source: Public Records
Map
Nearby Homes
- 119 N 800 W Unit Building A
- 119 & 141 N 800 W Unit B
- Lot 17 Parcel B-1382-0017-0000
- 1225 W Harding Ave Unit 8
- 237 N 400 W
- 6100 W 200 S
- 245 S 800 W
- 265 S 900 W
- 4961 N 900 W Unit lot 68
- 261 N 300 W
- 240 N 1400 W
- 373 N 400 W
- 376 N 400 W
- 465 N 800 W Unit 3
- 465 N 800 W Unit 7
- 465 N 800 W Unit 2
- 0 1 Af Water (Wr # 73-999) Unit 25-265506
- 4.12 Acre Water Rights
- 293 S 450 W