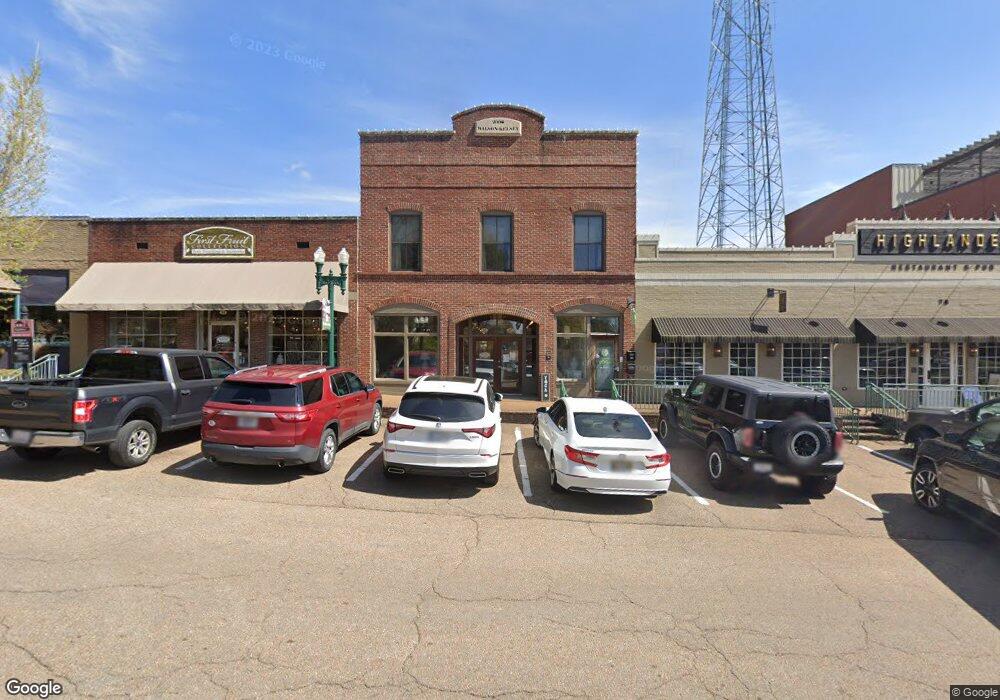
80 N Main St Collierville, TN 38017
Estimated Value: $766,096
1
Bed
1
Bath
5,700
Sq Ft
$134/Sq Ft
Est. Value
About This Home
This home is located at 80 N Main St, Collierville, TN 38017 and is currently estimated at $766,096, approximately $134 per square foot. 80 N Main St is a home located in Shelby County with nearby schools including Tara Oaks Elementary School, Collierville Middle School, and Collierville High School.
Ownership History
Date
Name
Owned For
Owner Type
Purchase Details
Closed on
Sep 17, 2018
Sold by
Kelsey William M and Kelsey Judith Wilson
Bought by
Kelsey William M and Kelsey Judith W
Current Estimated Value
Purchase Details
Closed on
Feb 8, 2018
Sold by
National Housing Corporation Of Memphis
Bought by
The Memphius Acquisitions Llc
Purchase Details
Closed on
Feb 7, 2018
Sold by
Community Housing Development Llc
Bought by
National Housing Corporation Of Memphis
Purchase Details
Closed on
Jul 11, 2017
Sold by
Community Housinh Development Llc
Bought by
Luo Cynthia Caiping
Purchase Details
Closed on
May 10, 2017
Sold by
Easy Way Food Stores Inc
Bought by
Community Housing Development Llc
Purchase Details
Closed on
Oct 27, 2003
Sold by
Wilson Michael Carter and Kelsey Judith Wilson
Bought by
Kelsey William M and Kelsey Judith Wilson
Create a Home Valuation Report for This Property
The Home Valuation Report is an in-depth analysis detailing your home's value as well as a comparison with similar homes in the area
Home Values in the Area
Average Home Value in this Area
Purchase History
| Date | Buyer | Sale Price | Title Company |
|---|---|---|---|
| Kelsey William M | -- | None Available | |
| The Memphius Acquisitions Llc | $485,743 | None Available | |
| National Housing Corporation Of Memphis | -- | None Available | |
| Luo Cynthia Caiping | -- | First Amer Title Ins Co | |
| Community Housing Development Llc | $245,000 | None Available | |
| Kelsey William M | -- | -- |
Source: Public Records
Tax History Compared to Growth
Tax History
| Year | Tax Paid | Tax Assessment Tax Assessment Total Assessment is a certain percentage of the fair market value that is determined by local assessors to be the total taxable value of land and additions on the property. | Land | Improvement |
|---|---|---|---|---|
| 2025 | $5,496 | $239,320 | $12,160 | $227,160 |
| 2024 | $5,496 | $162,120 | $7,520 | $154,600 |
| 2023 | $8,479 | $162,120 | $7,520 | $154,600 |
| 2022 | $8,284 | $162,120 | $7,520 | $154,600 |
| 2021 | $9,727 | $162,120 | $7,520 | $154,600 |
| 2020 | $8,726 | $148,400 | $7,520 | $140,880 |
| 2019 | $6,010 | $148,400 | $7,520 | $140,880 |
| 2018 | $6,010 | $148,400 | $7,520 | $140,880 |
| 2017 | $8,518 | $148,400 | $7,520 | $140,880 |
| 2016 | $6,667 | $152,560 | $0 | $0 |
| 2014 | $6,667 | $152,560 | $0 | $0 |
Source: Public Records
Map
Nearby Homes
- 259 Washington St
- 240 Burrows Rd
- 311 Washington St
- 146 Serenbe Cove
- 255 Ellawood Ln
- 319 E Poplar Ave
- 275 Ellawood Ln
- 144 Sycamore Rd
- 293 Washington St
- 232 W Poplar Ave
- 208 Sycamore Rd
- 281 Briarbrook Cove
- 284 Peterson Lake Rd
- 354 Distribution Pkwy
- 289 Harris St
- 319 Homeville Rd
- 306 W Poplar Ave
- 110 Hillwood Ln
- 354 College St
- 407 S Main Extension
- 84 N Main St
- 78 N Main St
- 88 N Main St
- 74 N Main St
- 94 N Main St
- 140 S Main St
- 110 N Main St
- 112 N Main St
- 114 N Main St
- 116 N Main St
- 126 E Mulberry St
- 136 E Mulberry St
- 134 E Mulberry St
- 120 N Main St
- 132 E Mulberry St
- 128 E Mulberry St
- 122 E Mulberry St
- 124 E Mulberry St
- 118 E Mulberry St
- 114 E Mulberry St