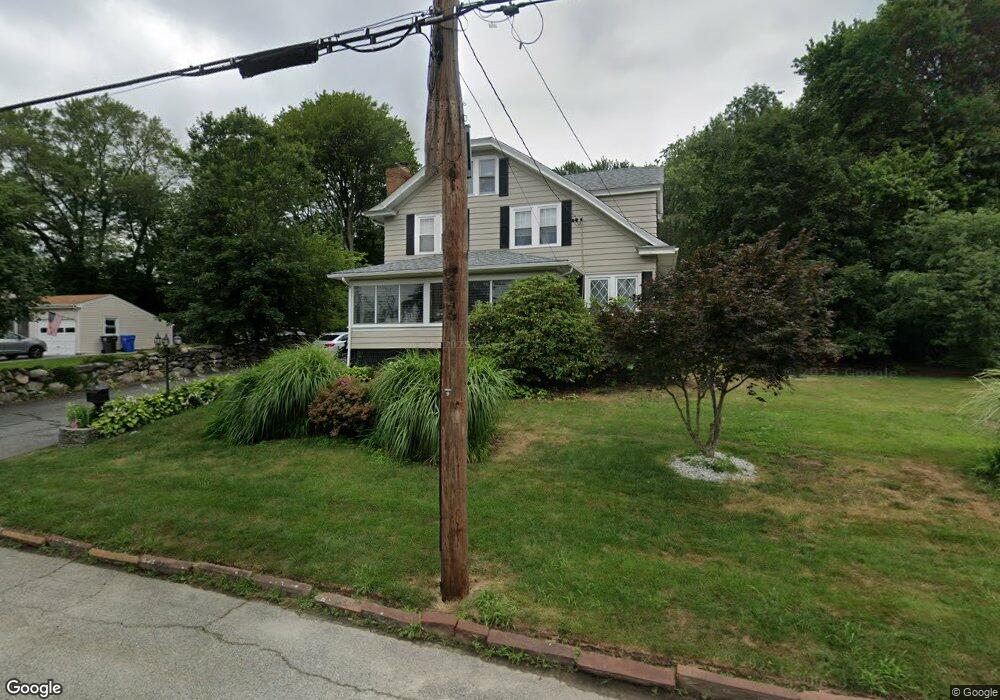
80 Old Spring Rd Cranston, RI 02920
Garden Hills NeighborhoodEstimated Value: $533,000 - $612,748
3
Beds
2
Baths
2,728
Sq Ft
$209/Sq Ft
Est. Value
About This Home
This home is located at 80 Old Spring Rd, Cranston, RI 02920 and is currently estimated at $570,937, approximately $209 per square foot. 80 Old Spring Rd is a home located in Providence County with nearby schools including Glen Hills School, Western Hills Middle School, and Cranston High School West.
Ownership History
Date
Name
Owned For
Owner Type
Purchase Details
Closed on
Jul 15, 2022
Sold by
Pellegrino Nancy A
Bought by
Dellava Joseph and Dellava Cherish
Current Estimated Value
Home Financials for this Owner
Home Financials are based on the most recent Mortgage that was taken out on this home.
Original Mortgage
$300,000
Outstanding Balance
$283,740
Interest Rate
5.09%
Mortgage Type
Purchase Money Mortgage
Estimated Equity
$287,197
Purchase Details
Closed on
Aug 7, 2015
Sold by
Rourke James
Bought by
Pellegrino Nancy A
Home Financials for this Owner
Home Financials are based on the most recent Mortgage that was taken out on this home.
Original Mortgage
$194,596
Interest Rate
4.03%
Mortgage Type
FHA
Purchase Details
Closed on
Dec 1, 2014
Sold by
Robertson Real Estate
Bought by
Rourke James
Purchase Details
Closed on
Jul 24, 2009
Sold by
Pellegrino Nancy A
Bought by
Robertson Re
Purchase Details
Closed on
Mar 4, 1991
Sold by
Michael Isaac J
Bought by
Marocco Louis J
Create a Home Valuation Report for This Property
The Home Valuation Report is an in-depth analysis detailing your home's value as well as a comparison with similar homes in the area
Home Values in the Area
Average Home Value in this Area
Purchase History
| Date | Buyer | Sale Price | Title Company |
|---|---|---|---|
| Dellava Joseph | $500,000 | None Available | |
| Pellegrino Nancy A | $225,000 | -- | |
| Rourke James | $170,000 | -- | |
| Robertson Re | $170,500 | -- | |
| Marocco Louis J | $102,000 | -- |
Source: Public Records
Mortgage History
| Date | Status | Borrower | Loan Amount |
|---|---|---|---|
| Open | Dellava Joseph | $300,000 | |
| Previous Owner | Marocco Louis J | $230,000 | |
| Previous Owner | Marocco Louis J | $194,596 |
Source: Public Records
Tax History
| Year | Tax Paid | Tax Assessment Tax Assessment Total Assessment is a certain percentage of the fair market value that is determined by local assessors to be the total taxable value of land and additions on the property. | Land | Improvement |
|---|---|---|---|---|
| 2025 | $6,228 | $448,700 | $138,900 | $309,800 |
| 2024 | $6,107 | $448,700 | $138,900 | $309,800 |
| 2023 | $5,800 | $306,900 | $95,700 | $211,200 |
| 2022 | $5,681 | $306,900 | $95,700 | $211,200 |
| 2021 | $5,524 | $306,900 | $95,700 | $211,200 |
| 2020 | $5,604 | $269,800 | $100,300 | $169,500 |
| 2019 | $5,604 | $269,800 | $100,300 | $169,500 |
| 2018 | $3,488 | $269,800 | $100,300 | $169,500 |
| 2017 | $5,356 | $233,500 | $91,200 | $142,300 |
| 2016 | $5,242 | $233,500 | $91,200 | $142,300 |
| 2015 | $5,051 | $225,000 | $91,200 | $133,800 |
| 2014 | $5,162 | $226,000 | $91,200 | $134,800 |
Source: Public Records
Map
Nearby Homes
- 14 Amanda St
- 20 Hilltop Dr
- 33 Rose Hill Dr
- 78 Wilbur Ave
- 20 Manilla Ave
- 264 Locust Glen Dr
- 50 Briarwood Rd
- 200 Mayfield Ave Unit C8
- 52 Cottonwood Dr
- 87 Lincoln Park Ave
- 309 East St
- 82 Mountain Laurel Dr
- 1027 Providence St Unit 4B
- 339 East St
- 10 East St Unit 316
- 157 Sweetbriar Dr
- 80 Conley Ave Unit 9
- 14 W Natick Rd
- 42 Woodland Dr
- 1100 Phenix Ave
- 70 Old Spring Rd
- 88 Old Spring Rd
- 77 Old Spring Rd
- 85 Old Spring Rd
- 85 Spring Rd
- 69 Normandy Dr
- 112 Coolspring Dr
- 63 Normandy Dr
- 73 Old Spring Rd
- 92 Old Spring Rd
- 62 Spring Rd
- 62 Old Spring Rd
- 91 Old Spring Rd
- 120 Coolspring Dr
- 106 Coolspring Dr
- 98 Old Spring Rd
- 73 Normandy Dr
- 45 Old Spring Rd
- 1050 Oaklawn Ave
- 1060 Oaklawn Ave
Your Personal Tour Guide
Ask me questions while you tour the home.