Estimated Value: $803,757 - $1,110,000
4
Beds
3
Baths
2,518
Sq Ft
$370/Sq Ft
Est. Value
About This Home
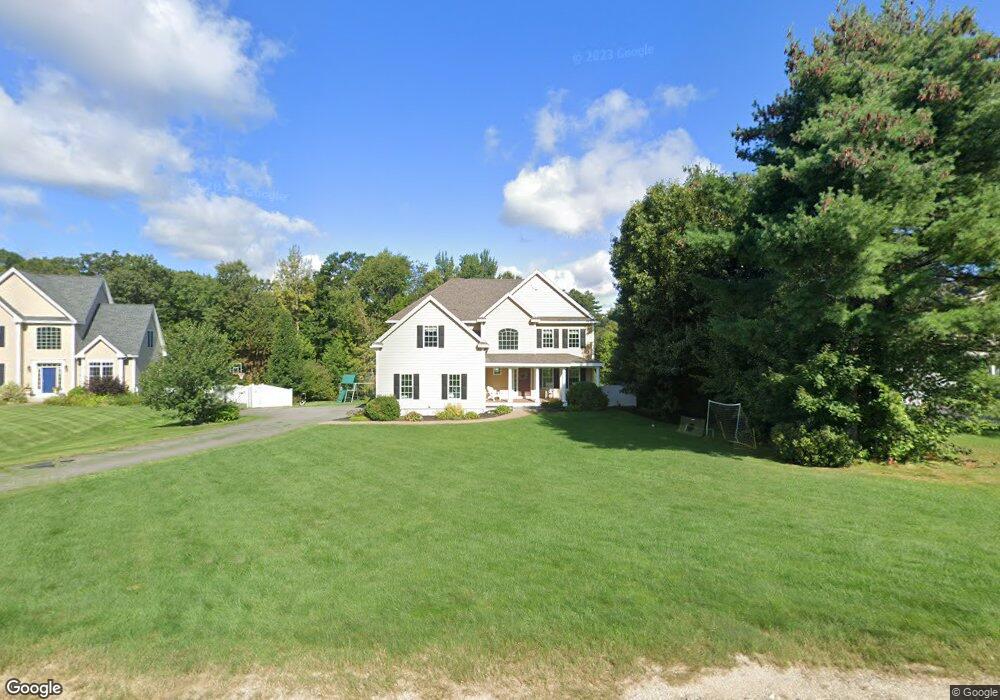
This home is located at 80 Peaslee Rd, Bow, NH 03304 and is currently estimated at $930,439, approximately $369 per square foot. 80 Peaslee Rd is a home with nearby schools including Bow Elementary School, Bow Memorial School, and Bow High School.
Ownership History
Date
Name
Owned For
Owner Type
Purchase Details
Closed on
Jul 10, 2012
Sold by
Tyler Builders Inc
Bought by
Glasier David and Glasier Angela
Current Estimated Value
Purchase Details
Closed on
Mar 8, 2012
Sold by
Farrell Robert E and Farrell Debra L
Bought by
Tyler Builders Inc
Home Financials for this Owner
Home Financials are based on the most recent Mortgage that was taken out on this home.
Original Mortgage
$280,000
Interest Rate
3.99%
Mortgage Type
Stand Alone Refi Refinance Of Original Loan
Create a Home Valuation Report for This Property
The Home Valuation Report is an in-depth analysis detailing your home's value as well as a comparison with similar homes in the area
Home Values in the Area
Average Home Value in this Area
Purchase History
| Date | Buyer | Sale Price | Title Company |
|---|---|---|---|
| Glasier David | $365,000 | -- | |
| Glasier David | $365,000 | -- | |
| Tyler Builders Inc | $85,000 | -- | |
| Tyler Builders Inc | $85,000 | -- |
Source: Public Records
Mortgage History
| Date | Status | Borrower | Loan Amount |
|---|---|---|---|
| Open | Tyler Builders Inc | $348,500 | |
| Previous Owner | Tyler Builders Inc | $280,000 |
Source: Public Records
Tax History
| Year | Tax Paid | Tax Assessment Tax Assessment Total Assessment is a certain percentage of the fair market value that is determined by local assessors to be the total taxable value of land and additions on the property. | Land | Improvement |
|---|---|---|---|---|
| 2025 | $16,778 | $836,800 | $158,800 | $678,000 |
| 2024 | $16,552 | $836,800 | $158,800 | $678,000 |
| 2023 | $13,924 | $500,700 | $112,900 | $387,800 |
| 2022 | $13,279 | $500,700 | $112,900 | $387,800 |
| 2021 | $12,044 | $472,500 | $112,900 | $359,600 |
| 2020 | $12,087 | $472,500 | $112,900 | $359,600 |
| 2019 | $12,384 | $472,500 | $112,900 | $359,600 |
| 2018 | $11,190 | $402,800 | $94,600 | $308,200 |
| 2017 | $11,186 | $402,800 | $94,600 | $308,200 |
| 2016 | $10,590 | $402,800 | $94,600 | $308,200 |
| 2015 | $10,429 | $365,400 | $94,600 | $270,800 |
| 2014 | $10,783 | $365,400 | $94,600 | $270,800 |
| 2011 | -- | $85,500 | $85,500 | $0 |
Source: Public Records
Map
Nearby Homes
Your Personal Tour Guide
Ask me questions while you tour the home.