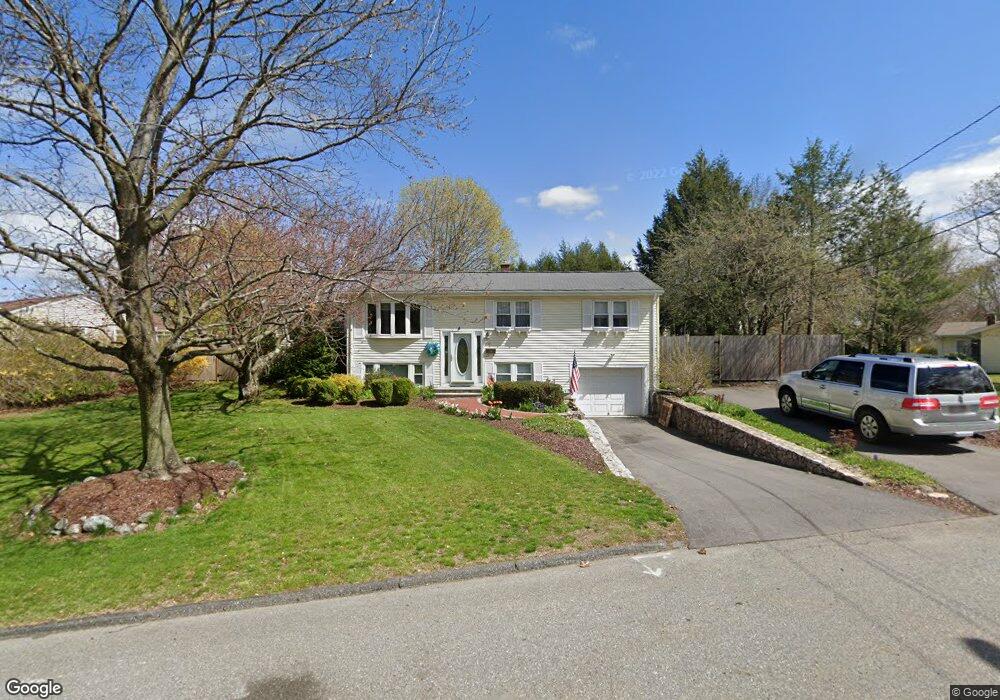
80 Roundtop Rd Framingham, MA 01701
Nobscot NeighborhoodEstimated Value: $584,000 - $684,680
4
Beds
2
Baths
1,344
Sq Ft
$474/Sq Ft
Est. Value
About This Home
This home is located at 80 Roundtop Rd, Framingham, MA 01701 and is currently estimated at $636,420, approximately $473 per square foot. 80 Roundtop Rd is a home located in Middlesex County with nearby schools including Framingham High School and Sudbury Valley School.
Ownership History
Date
Name
Owned For
Owner Type
Purchase Details
Closed on
Mar 18, 2010
Sold by
Lillis Stephen J and Gantman-Lillis Kathryn S
Bought by
Lillis Tr Stephen J and Gantman-Lillis Kathryn
Current Estimated Value
Purchase Details
Closed on
Sep 30, 1991
Sold by
Boroff Henry J
Bought by
Lillis Stephen
Purchase Details
Closed on
Jun 10, 1987
Sold by
Sweeney Mary F
Bought by
Boroff Henry J
Create a Home Valuation Report for This Property
The Home Valuation Report is an in-depth analysis detailing your home's value as well as a comparison with similar homes in the area
Home Values in the Area
Average Home Value in this Area
Purchase History
| Date | Buyer | Sale Price | Title Company |
|---|---|---|---|
| Lillis Tr Stephen J | -- | -- | |
| Lillis Tr Stephen J | -- | -- | |
| Lillis Stephen | $173,500 | -- | |
| Lillis Stephen | $173,500 | -- | |
| Boroff Henry J | $178,500 | -- |
Source: Public Records
Mortgage History
| Date | Status | Borrower | Loan Amount |
|---|---|---|---|
| Open | Boroff Henry J | $200,000 | |
| Previous Owner | Boroff Henry J | $100,000 | |
| Previous Owner | Boroff Henry J | $129,200 |
Source: Public Records
Tax History
| Year | Tax Paid | Tax Assessment Tax Assessment Total Assessment is a certain percentage of the fair market value that is determined by local assessors to be the total taxable value of land and additions on the property. | Land | Improvement |
|---|---|---|---|---|
| 2025 | $7,168 | $600,300 | $265,000 | $335,300 |
| 2024 | $6,715 | $538,900 | $236,600 | $302,300 |
| 2023 | $6,329 | $483,500 | $211,200 | $272,300 |
| 2022 | $5,989 | $435,900 | $191,600 | $244,300 |
| 2021 | $5,850 | $416,400 | $184,200 | $232,200 |
| 2020 | $5,875 | $392,200 | $167,400 | $224,800 |
| 2019 | $5,792 | $376,600 | $167,400 | $209,200 |
| 2018 | $5,694 | $348,900 | $161,100 | $187,800 |
| 2017 | $5,554 | $332,400 | $156,400 | $176,000 |
| 2016 | $5,546 | $319,100 | $156,400 | $162,700 |
| 2015 | $5,517 | $309,600 | $156,700 | $152,900 |
Source: Public Records
Map
Nearby Homes
Your Personal Tour Guide
Ask me questions while you tour the home.